A simple and rapid magnetic solid phase extraction technique followed by micro-volume UV-Vis spectrophotometry for the determination of Ondansetron in different real samples
Received: 14-Mar-2022, Manuscript No. PULJBB-22-4636; Editor assigned: 16-Mar-2022, Pre QC No. PULJBB-22-4636 (PQ); Accepted Date: Apr 02, 2022; Reviewed: 02-Apr-2022 QC No. PULJBB-22-4636 (Q); Revised: 09-Apr-2022, Manuscript No. PULJBB-22-4636 (R); Published: 13-Apr-2022, DOI: 10.37532/puljbb.22.6(2).11-14
Citation: Nazari S, Sepehri A. A simple and rapid magnetic solid phase extraction technique followed by micro-volume UV Vis spectrophotometry for determination of Ondansetron in different real samples. J Biomol Biochem. 2022;6(2):06-09.
This open-access article is distributed under the terms of the Creative Commons Attribution Non-Commercial License (CC BY-NC) (http://creativecommons.org/licenses/by-nc/4.0/), which permits reuse, distribution and reproduction of the article, provided that the original work is properly cited and the reuse is restricted to noncommercial purposes. For commercial reuse, contact reprints@pulsus.com
Abstract
A simple, sensitive and rapid solid phase extraction technique was used for preconcentration of trace levels of Ondansetron (OND) in different real samples followed by UV-Vis spectrophotometry detection. By using a batch method, Active carbon-Fe3O4-pyridine (AC-Fe3O4-Py) was used as adsorbent to preconcentration of OND in the sample solution. After elution of adsorbent with ethanol, the retained analyte was measured at 265 nm by UV-Vis spectrophotometry. FT-IR spectroscopy, Scanning Electron Microscopy (SEM) and Transmission Electron Microscopy (TEM) were used to characterize the synthesized adsorbent. In this study, different parameters affecting the extraction efficiency such as pH, amounts of adsorbent, extraction time, type of eluent solvent, desorption time were investigated and optimum conditions were selected. Under the optimum conditions, the calibration curve was linear in the range of 0.02 mg-0.56 mg L-1 OND with a correlation coefficient of 0.9995. The Relative Standard Deviation (RSD) based on five replicate analysis of 0.4 mg L -1 OND was 1.2% and the Limit of Detection (LOD) based on seven replicate analysis of blank was 0.02 mg L-1.
Keywords
Ondansetron, solid phase extraction, UV-Vis spectrophotometry, Active carbon-Fe3O4
Introduction
The Ondansetron (OND) is a selective and potent 5 hydroxytryptamine, (5-HT,) receptor antagonist which is in use to prevent nausea and vomiting that may be caused by surgery, cancer chemotherapy, or radiation treatment [1]. Different analytical techniques such as High Performance Liquid Chromatography (HPLC) combined with mass spectrometry/UV-Vis detection [2-4], modified electrode [5], spectrophotometry [6], electrophoresis [7, 8], supercritical fluid chromatography [9] and high performance thin layer chromatography (HPTLC) [10] were used for determination of ondansetron in different real samples. However, most of these methods are timeconsuming, solvent-usage intensive, expensive and involve tedious sample preparation. In order to achieve reliable result for determination of OND in different real samples, development of sensitive analytical technique is highly demanded. Solid Phase Extraction (SPE) is one of the most common techniques for preconcentration of trace levels of analyte due to its rapidity, simplicity and high enrichment factor [11, 12].
In this paper, we used solid phase extraction followed by UV-Vis spectrophotometry for preconcentration and determination of trace levels of OND in different real samples. Active Carbon (AC) was magnetized by Fe3O4 to produce AC-Fe3O4. The resultant residue was impregnated in the pyridine liquid (Py) to produce AC-Fe3O4-Py. The synthesized AC-Fe3O4-Py was used as adsorbent in solid phase extraction. FT-IR spectroscopy, Transmission Electron Microscopy (TEM) and Scanning Electron Microscopy (SEM) were used to characterize the synthesized adsorbent and based on the results; AC-Fe3O4 was successfully modified with pyridine. The experimental parameters affecting the extraction efficiency were completely investigated and optimum conditions were selected. This rapid, non-expensive and sensitive technique was used for determination of OND in different real samples.
Experimental
Instrumentation A Shimadzu 2550 UV-Vis spectrophotometer equipped with 150 µL microcell was used to measure the absorbance of analyte at 265 nm. The pH values were measured with a pH meter (PAAT-ARIYA-CO, Iran) supplied with a glass-combined electrode. For adsorbent collection and magnetic decantation, a Nd-Fe-B magnet (5 cm × 4 cm × 2 cm, 2 T) was used. A magnetic stirrer (VELP Scientifica, Italy) was used for stirring the sample solution.
Reagents All reagents were of analytical reagent grade and deionized water was used throughout. Ondanseron hydrochloride (purity, 99.00%) was provided as tablet from Tehran Chemie Pharmaceutical Company, Tehran, Iran. Ethanol, methanol, acetonitrile and acetone were used as desorbent solvents and purchased from Merck, Darmstadt, Germany. NH3 (25%), FeCl3.6H2O and FeCl2.H2O were purchased from Merck, Darmstadt (Germany) and used for synthesis of Fe3O4 nanoparticle. Active carbon (AC) was purchased from Merck, Darmstadt, Germany. The buffer solution of 0.5 mol L-1 sodium acetate/acetic acid was prepared by dissolving appropriate amounts of sodium acetate and acetic acid.
Synthesis of active carbon-Fe3O4 The magnetic Fe3O4 was prepared by coprecipitation of Fe(III) and Fe(II) ions. A volume of 200 mL of solution containing FeCl3.6H2O (4.43 g) and FeCl2.H2O (1.62 g) was heated at 80°C under N2 atmosphere with vigorous stirring (700 rpm). By addition of 10 mL of ammonia solution (25 wt%) to the mixture; the black precipitate was formed. The mixture was stirred for 45 min and then collected using Nd-Fe-B magnet while the solution was decanted. The black precipitate was washed with deionized water for several times and then dried in vacuum oven at 50°C overnight.
The Fe3O4-activated carbon magnetic nanoparticles (AC-Fe3O4) were prepared by a chemical co-precipitation method [13]. Briefly, a known amount of activated carbon was dispersed in the concentrated nitric acid (65%) for 4 h at 75°C in ultrasonic bath. The residue was filtrated and dried at 50°C for 5 h. Subsequently, 5 g of obtained powder impregnated into a 200 mL of aqueous solution containing Fe3O4 and placed in ultrasonic bath for 1 h at 80°C. Then, sample solution was filtrated and dried in vaccum oven at 100°C for 2 h. The residue was heated at 750°C for 3 h under nitrogen gas in other to formation of AC-Fe3O4 magnetic nanoparticles. Finally, the synthesized adsorbent washed several times with deionized water and dried at 80°C for 5 h.
Pyridine impregnated AC-Fe3O4 (AC-Fe3O4-Py) 2.0 g of Fe3O4-AC nanocomposite was impregnated in 20 mL of pyridine for 2 h under stirring. Subsequently, the precipitate was collected with magnetic field and decanted. The residue was washed several times with ethanol followed by deionized water to remove excess amounts of pyridine. Finally, pyridine impregnated AC-Fe3O4 (AC-Fe3O4-Py) was dried in vacuum oven at 60°C overnight.
PREPARATION OF REAL SAMPLES
Water and human serum samples Different water samples were collected from their local sources and analyzed for their OND content according to the microextraction procedure. Human serum samples were obtained from healthy volunteers and stored frozen until assay. An aliquot of serum sample was mixed with acetonitrile to remove serum protein [5]. The mixture was vortex for 100 sec and centrifuged for 10 min at 6000 rpm. Finally, an aliquot of supernatant was diluted to five milliliter with buffer solution at pH 6 and analyzed for their OND content according to the preconcentration procedure.
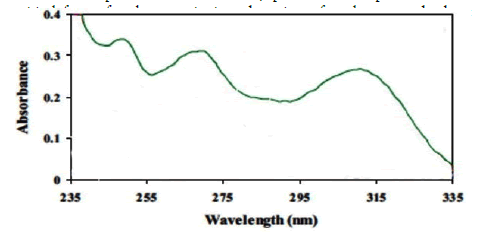
Preconcentration procedure Five milliliter of sample solution containing 0.4 mg L-1 OND was adjusted at pH 6 with 0.5 mol L-1 acetic acid buffer. Then, 0.003 g of adsorbent was added to the sample solution and stirred at 5000 rpm for 10 min. The AC-Fe3O4-Py was then collected from the sample solution by a piece of permanent magnet. The supernatant was decanted follow by addition of 150 µL ethanol and it was stirred again for 8 min. Finally, the supernatant was transferred into the microcell and the ultra-violet spectrum was recorded against blank signal. The ultraviolet spectrum of OND was depicted in Figure 1. As it shown, 265 nm was selected as optimum wavelength for determination of OND.
Results and Discussions
Characteristics of adsorbent
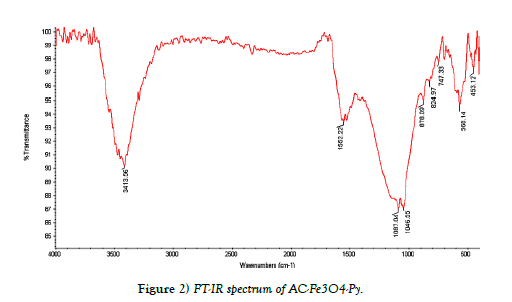
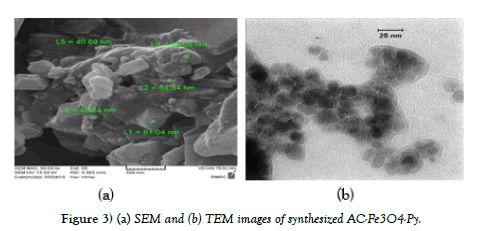
FT-IR spectroscopy, TEM and SEM images were used to characterize of synthesized AC-Fe3O4-Py. Figure 2. shows the FT-IR spectrum of ACFe 3O4-Py. It is well documented that the adsorption of aromatic compounds on AC is due to interactions between the p electrons of the aromatic ring in the AC and the p electrons of the aromatic ring in the organic compound (Py). These interactions are known as p-p dispersion interactions. Pyridine can be adsorbed on AC by p-p dispersion interactions because pyridine is a p electron heteroaromatic compound. Consequently, the p-p dispersion interactions are very important on the pyridine adsorption on AC. As shown in Figure 2, a broad peak in 3100 cm-1-3500 cm-1 can be assigned to OH on the surface of AC and Fe3O4. The peak at 565 cm-1 and 1080 cm-1 related to Fe-O and C-O-C epoxy group respectively; and the peak appeared in the region of 1620 cm-1-1650 cm-1 is due to C=N from the pyridine. Also, the images of scanning electron microscopy (SEM) and transmission electron microscopy (TEM) of adsorbent (AC-Fe3O4-Py) were shown in Figure 3. The SEM image shows a porous structure for adsorbent and as TEM image shows; the Fe3O4 nanoparticles with the mean size of about 20 nm were successfully deposited on the surface of AC.
Sample and sampling techniqu Effect of pH
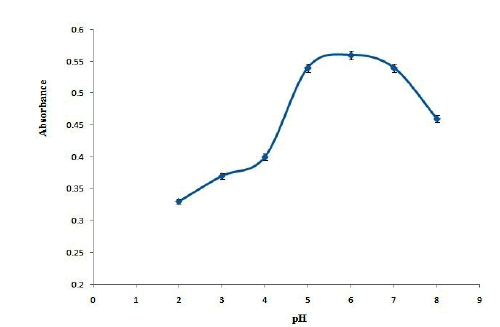
In the solid phase extraction studies, pH of the sample solution is of 2-8. Based on the results are shown in Figure 4. maximum absorbance was obtained in the pH range of 5-7 and it reduces in pH below than 5 or higher than 7. It can be concluded that maximum extraction efficiency was obtained in neutral pH values and the extraction efficiency decreases in acidic and basic solutions. To explain this behavior, it should be considering that pyridinic nitrogen could activate the p electrons in C and therefore C has partial positive charge [15]. In neutral pH solution, OND as an electron donor compound could attract to the adsorbent. However, in basic solutions hydroxyl group could compete with OND and reduces the extraction efficiency. Also, in acidic solutions the repulsion between the positive protons of the surface of adsorbent and probably positive charges of OND molecule reduces the extraction efficiency [16]; therefore, pH 6 was selected as optimum pH values.
Effect of amounts of adsorbent
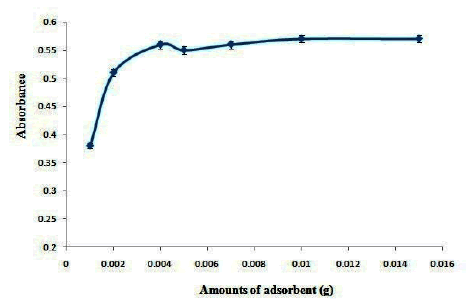
The effect of amounts of AC- Fe3O4-Py on the absorbance of OND was investigated in the range of 0.001 g-0.01 g. The results are shown in Figure 5. Based on the results the maximum extraction efficiency was obtained in 0.003 g of adsorbent and no change in extraction efficiency was observed at higher amounts of adsorbent. Therefore, 0.003 g of AC- Fe3O4-Py was selected as optimum values.
Effect of type and volume of desorbent solvent
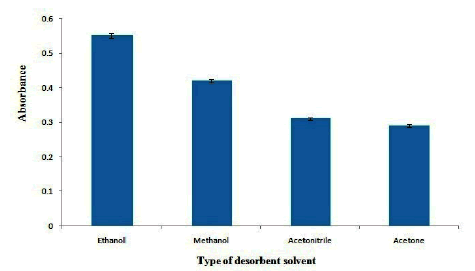
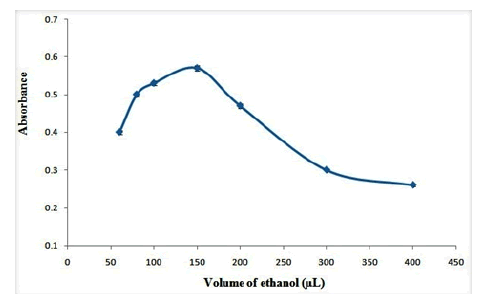
In order to desorb OND from adsorbent, different desorbent solvents including methanol, ethanol, acetone and acetonitrile were tested. The results are shown in Figure 6. As the results shown, ethanol provides maximum extraction efficiency for desorbing of OND from adsorbent. Therefore, ethanol was selected as the desorbent solvent. Also, the effect of volume of ethanol on the absorbance of OND was studied in the range of 40 µL-400 µL. The results show that (Figure 7), the extraction efficiency reaches to its maximum in 150 µL of ethanol and it decreases gradually at higher volumes of ethanol which may be related to the dilution of desorbent solution. Therefore, 150 µL of ethanol was selected as the optimum desorbent volume.
Effect of extraction and desorbent time
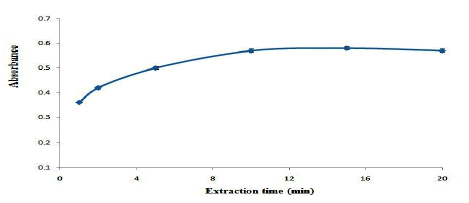
The effect of extraction time on the extraction efficiency of OND was studied in the range of 1 min-20 min. based on the results are shown in Figure. 8, the extraction efficiency reaches to its maximum value at 10 min and it remains constant afterwards. Therefore, 10 min extraction time was selected as the optimum extraction time. Also, the effect of desorbent time on the extraction efficiency of OND was studied in the range of 1 min-10 min. the results show that, 8 min desorbent time is adequate to reach the maximum extraction efficiency.
Effect of stirrer rate
The effect of stirrer rate on the absorbance of OND was studied in the range of 1200 rpm-10000 rpm with constant extraction time of 10 min. Based on the results; maximum absorbance was achieved in 5000 rpm and remained constant at higher stirrer rates. Therefore, 5000 rpm was selected as optimum stirrer rate.
Analytical figures of merit
Under the optimum conditions, the calibration curve is linear in the range of 0.02 mgL-1-0.56 mgL-1 OND with a correlation coefficient 0.9995. The calibration equation is A=1.4552COND+0.0062 A is the absorbance of OND and C is the concentration of OND in mg L-1. The relative standard deviation (RSD, %) based on five replicate analysis of 0.4 mg L-1 OND was 1.2%. The detection limit for OND found to be 0.02 mg L-1 (n=7) and its Limit of Quantification (LOQ) was 0.066 mg L-1 (n=7). The preconcentration factor (PF) defined as the volume of sample solution (5 mL) divided to the volume of desorbent solvent (150 µL) was 33. The enhancement factor (EF) was defined as the slope of calibration curve after preconcentration step to that of before calibration step was 21.5.
Real sample analysis
The literature recommends counselling of clients on physical activities before the commencement of the exercise. activity level need to be assessed and for adjustment the activities of cardiac clients according to age, gender and daily life such as driving, sexual activity, sports, gardening household tasks [16]. As part of physical activities, exercises for cardiac patients are also adjusted. In order to check the applicability of the method for determination of OND, different real sample including water and serum samples were analyzed and the results are demonstrated in Table 1. Also, spike method was performed to evaluate the validity of the method. The results show that, this technique has a good applicability for determination of trace levels of OND in human serum and water samples.
Table 1 Results for the analysis of OND content in different real samples. Results (mean ± standard deviation based on three time replicate analysis).
| Sample |
Added(mg L-1 |
Founded (mg L-1) |
Recovery % |
|---|---|---|---|
| Spring Waterab | - | ND | - |
| 0.4 | 0.39 ± 0.01 | 97.5 | |
| Human Serum (No.1) | - | ND | - |
| 0.25 | 0.23±0.01 | 92 | |
| Human Serum (No.2) | - | ND | - |
| 0.25 | 0.24 ± 0.01 | 96 |
Conclusion
A rapid, non-expensive and sensitive solid phase extraction technique was applied to determine trace levels of OND in different real samples. Active carbon- Fe3O4-Pyridine was synthesized and used as adsorbent in solid phase extraction for preconcentration of OND. FT-IR spectroscopy, transmission electron micrography (TEM) and scanning electron microscopy (SEM) were applied for characterization the synthesized adsorbent. The results indicate that this sensitive and rapid technique can be applied to determine trace levels of OND in different real samples
REFERENCES
- Markham A, Sorkin EM. Drugs. Ondansetron. An update of its therapeutic use in chemotherapy-induced and postoperative nausea and vomiting. PubMed.1993;45(6):931-52.
Google Scholar CrossRef - Liu k, Dai X J, Zhong DF,et al. Quantitative determination of ondansetron in human plasma by enantioselective liquid chromatography-tandem mass spectrometry. J Chromatogr B.2008;864(1):129-36.
Google Scholar CrossRef - Sheshala R, Darwis RY, Khan N. Development and Validation of an RP–LC–UV Method for the Determination of Ondansetron: Application to Pharmaceutical Dosage Forms. Chromatographia.2009;70:75-81.
Google Scholar CrossRef - Zizkovsky V, Kucera R, Klimes J. Potential employment of non-silica-based stationary phases in pharmaceutical analysis. J Pharm Biomed Anal.2007;44:1048-55.
Google Scholar CrossRef - Nigović B, Sadiković M, Sertić M. Multi-walled carbon nanotubes/Nafion composite film modified electrode as a sensor for simultaneous determination of ondansetron and morphine. Talanta.2014;122:187-94.
Google Scholar CrossRef - Raza A, Ijaz AS, ur Rehman A, et al. Spectrophotometric Determination of Ondansetron Hydrochloride in Pharmaceutical Bulk and Dosage Forms. J Chin Chem Soc.2007;54:223-7.
Google Scholar CrossRef - Siluveru M, Stewart J T J. Enantioselective determination of S-(+)- and R-(−)-ondansetron in human serum using derivatized cyclodextrin-modified capillary electrophoresis and solid-phase extraction. Chromatogr B.1997;691(1):217-22.
Google Scholar CrossRef - Arama C, Varvara A, Monciu CM. Development and validation of a new capillary zone electrophoresis method for the assay of ondansetron. Farmacia.2011;59:34-43.
Google Scholar CrossRef - Hsieh Y, Favreau L, Schwerdt J, et al. Supercritical fluid chromatography/tandem mass spectrometric method for analysis of pharmaceutical compounds in metabolic stability samples. J Pharm Biomed Anal.2006;40:799-804.
Google Scholar CrossRef - Raval PB, Puranik M, Wadher SJ, et al. A Validated HPTLC Method for Determination of Ondansetron in Combination with Omeprazole or Rabeprazole in Solid Dosage Form. J Pharm Sci.2008;70:386-90.
Google Scholar CrossRef - Ninama G, Patel R, Patel M, et al. J Chem. 2013:6:134-38.
Google Scholar CrossRef - Xu X, Bartlett MG, Stewart JT. Determination of ondansetron and its hydroxy metabolites in human serum using solid-phase extraction and liquid chromatography/positive ion electrospray tandem mass spectrometry. J Mass Spec.2000;35(11):1329-34.
Google Scholar CrossRef - Do MH, Phan NH. Activated carbon/Fe3O4 nanoparticle composite: Fabrication, methyl orange removal and regeneration by hydrogen peroxide. Chemosphere.2011;85:1269-79.
Google Scholar CrossRef - Ghaedi M, Shokrollahi A, Kianfar A, et al. The determination of some heavy metals in food samples by flame atomic absorption spectrometry after their separation-preconcentration on bis salicyl aldehyde, 1,3 propan diimine (BSPDI) loaded on activated carbon. Hazard. Mater.2008;154:128-34.
Google Scholar CrossRef - Ensafi AA, Jafari-Asl M, Rezaei B. Pyridine-functionalized graphene oxide, an efficient metal free electrocatalyst for oxygen reduction reaction. Electrochim Acta.2016;194:95-103.
Google Scholar CrossRef - Alonso-Davila P, Torres-Rivera OL, Leyva-Ramos R ,et al. Removal of Pyridine from Aqueous Solution by Adsorption on an Activated Carbon Cloth. Clean Soil, Air, Wat.2012;40(1):45-53.
Google Scholar CrossRef


