A spatial vulnerability analysis of multi-hazard threat in Zayandeh- Roud basin in Isfahan, Isfahan province, Iran
2 Department of Water Engineering, Isfahan University of Technology, Isfahan, Iran
3 Department of Civil Engineering, Isfahan (Khorasgan) Branch, Islamic Azad University, Iran, Email: Koa.askari@khuisf.ac.ir
4 Department of Geography, Najafabad Branch, Islamic Azad University, Najafabad, Iran
5 Department of Biological and Agricultural Engineering, Zachry Department of Civil Engineering, Texas A&M University, Texas, USA
6 Department of Geography, University of Malaya, 50603 Kuala Lumpur, Malaysia
Received: 08-Sep-2017 Accepted Date: Oct 25, 2017; Published: 20-Feb-2018
Citation: Marani-Barzani M, Eslamian S, Ostad-Ali-Askari K, et al. A spatial vulnerability analysis of multi-hazard threat in Zayandeh-Roud basin in Isfahan, Isfahan province, Iran. J Environ Chem Toxicol. 2018;2(1):12-19.
This open-access article is distributed under the terms of the Creative Commons Attribution Non-Commercial License (CC BY-NC) (http://creativecommons.org/licenses/by-nc/4.0/), which permits reuse, distribution and reproduction of the article, provided that the original work is properly cited and the reuse is restricted to noncommercial purposes. For commercial reuse, contact reprints@pulsus.com
Abstract
Like any other country, Iran is jeopardized by many environmental hazard threats and such threats can culminate in environmental disasters with tremendous repercussions such as loss of people’s lives, destruction of national assets, disruption of man-made building, dangers threatening mass population, etc. To stand against this, approaches in hazard management are after finding more pragmatic solution for these repercussions. Moreover, these hazards are associated with desertification, tectonic, cycles of aridity and surface processes associated with wind and water erosion. This paper provides information on the threats and vulnerability imposed on Zayandeh- Roud Basin (Z.R.B, hereafter) in Iran. For this aim, assessment was carried out by overlaying hazards map, human variable, and adaptation capacity map. Results are in the form of classification vulnerability map with 5 levels: Very Low, Low, Threshold Level, High Resilience and Very High Resilience. Based on vulnerability map, most of the Northern, Eastern and North Western parts of Z.R.B were among the most vulnerable parts. Vulnerability on the central parts of Z.R.B took two forms of ‘very low’ and ‘low’ which were because of most adaptive capacity.
Vulnerability mapping assessment is a very important tool in risk analysis, especially in a multi-hazard region. The end product of this powerful tool is a spatial pattern account (including temporal surface change) of not a single hazard threat, but the one which is considered as a spatial-temporal database of the integrated nature of a multi-hazard threat in many regions of the world. This spatial- temporal database can be digital stored or produce maps. Spatial-temporal analysis of the data bases would have revealed a number of overarching features that are pertinent towards effective hazardthreat and risk reduction strategies. These overarching spatial–temporal patterns described the integrative-composite nature of multi-hazard threats patterns in space and time. These include distribution symmetry, clustering, direction tendencies and randomness of distribution.
Vulnerability has been introduced as a function of exposure, sensitivity and adaptive capacity. Since in developing countries, controlling land use is a difficult and requires great sensitivity, a vulnerability assessment framework was designed by the United Nations’ Inter-Governmental Panel on Climate Change (IPCC) [1,2]. Due to the notion that Iran is a developing country, it has been constantly facing issues such as urban development and immigration, lack of resources and hazard threats. In this sense, one important issue which might prove very helpful to hazard management is identification of vulnerability areas. For instance, earthquake hazard map is used for assessing level of damage caused by earthquake in USA. This is because the vulnerability map provides information that can lead to reduction of the effects of disasters through safety and environmentally conscious management of land use [3-6].
In this regard, one disadvantage of the structural vulnerability is that it is capable of preventing the damages imposed on buildings. So, use can be made of the early/emergency warning by using the simple and advanced technology which leads to reduction of the casualties and damages noticeably. Proper warning, exchange of information and quick communication are required to be taken into account before and during emergencies in the first golden hours. On-time and early warnings can diminish negative effects of disasters.
In addition, Classification Hazard Map can be utilized as another efficient tool for the assessment and management of hazards [7-9]. Classified hazard makes it possible to detect critical areas with high risks exist. The maps are important for the management of decisions and planning such as prediction and prevention of desertification and the reclamation of degraded lands [10-13].
In the same vein, the necessity of Hazard Management Process is felt for assessing hazards, too. Hazard management can be carried out with the aim of identifying critical factors so as to find out vulnerable points or the hazards. Another advantage that classification hazard map can have is recognition of hot spot or critical centers of a hazard. This can prove very helpful since recognition of critical centers can help prevent hazards [14-18].
The present study, thus, was aimed at identifying a critical center of hazards and area(s) which are mostly vulnerable to hazard. For this aim, critical center of three hazards, namely desertification, earthquake and aridity have been identified. Vulnerable and adaptive areas have been illustrated in the form of classification map and findings are expected to be used by policy-maker of the basin [19-26].
Study Region
Land use and urban activities in the Z.R.B. have increased noticeably during the last 5 decades. On the other hand, active threats in this area can alter the morphology and landscape of the zone, which can then affect human activities. So, recognition and evaluation of hazards would help one make better decisions with regard to management approach.
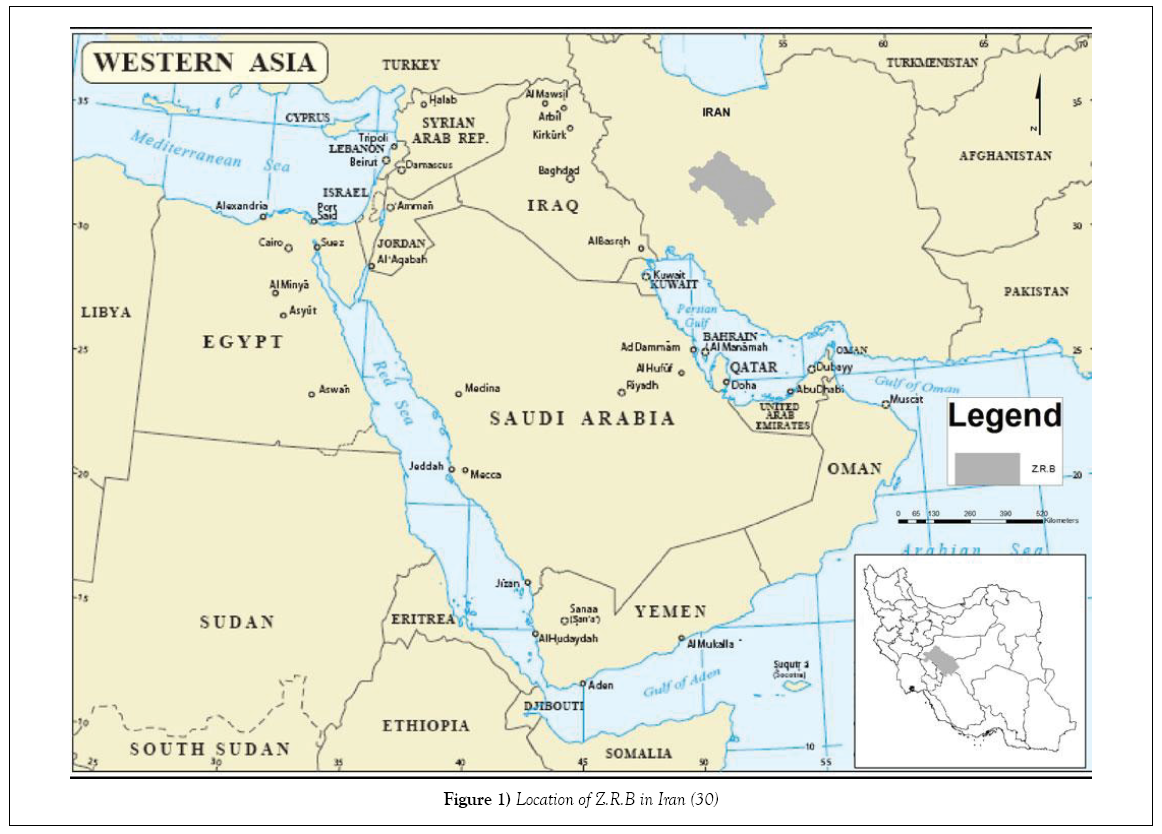
The Zayandeh-Roud Basin is located in the central part of Iran (Figure 1). The area of the basin is about 42,000 km2. The situation of this basin can also be seen on the map. As can be seen, there is more than one hazard in Z.R.B which is tectonic activities such as the earthquake, desertification and drought. On the other hand, human activities such as using land include land use, population and strategic situation especially in the largest city of the basin, Isfahan [27].
Growing population in Zayandeh-Roud Basin (Z.R.B) and growing the need for hazard management in the study area are the most important reasons for the application of risk analysis. In this study, risk hazard map will be provided for Z.R.B in Iran by using Arc map 10.1 Classification and composite methods were used to derive a composite hazard map of classified hazards map (Earthquake, desertification, Aridity and surface geomorphology) and human activities [26-31].
Methodology
In order to extract hazard vulnerability index, the following steps were followed:
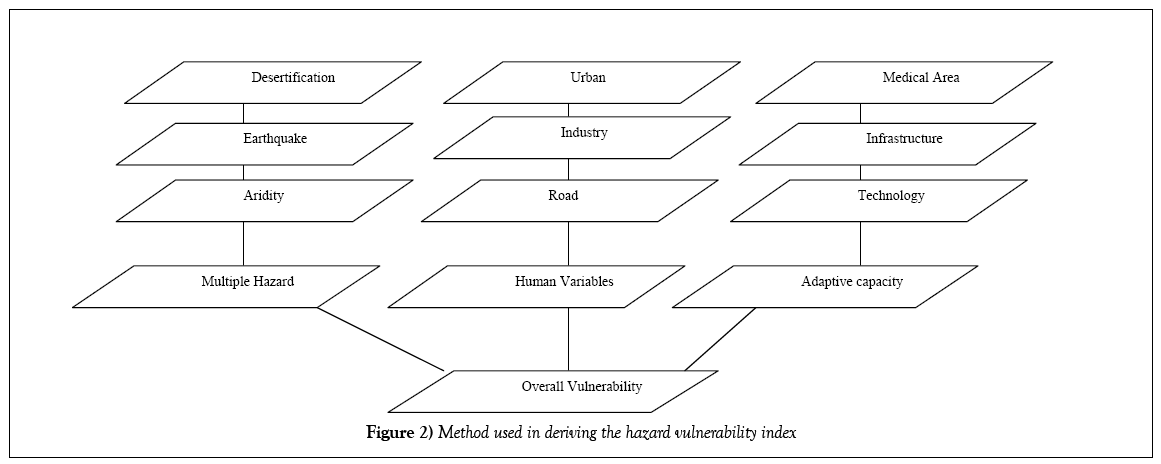
Using exposure information from historical records, the classification composite hazard map was obtained for three factors, namely desertification, earthquake and aridity hazards. Furthermore, human activities were classified for an easier recognition of the sensitivity to hazards exposure. The human variables were urban life, industry, and roads. The assumption here is that, given the same degree of exposure to hazards, an area with relatively less inhabited people is less vulnerable to hazards as compared to an area with higher population densities. What can have implied from this assumption is that distribution of humans in an area of land might add to its vulnerability to hazards. However, there are many different reasons for this which is not elaborated since they are out of the scope of the present study. Density of human variable is measured by the percentage of whole area in 10 km square grid. Finally, it is worth mentioning that Adaptive Capacity Index was constructed as a function of public areas, such as hospitals, schools, mosques and sport centers. Based on the above, an index of the overall hazards vulnerability was constructed. Figure 2 shows the steps of constructing the index [32-40].
Generating the Composite Maps for the Vulnerability Assessment
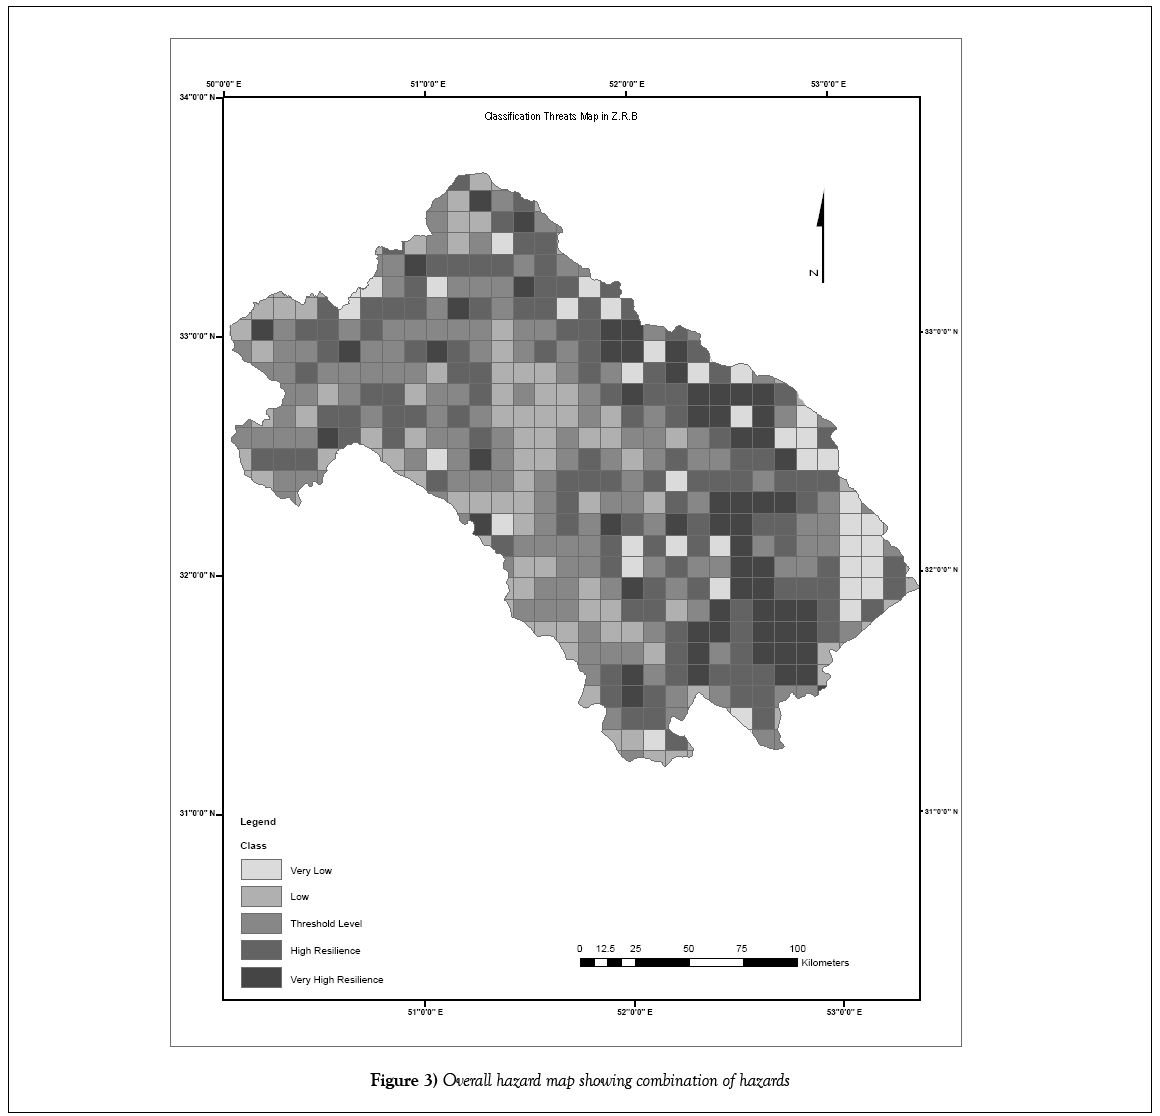
Figure 3 shows the overall hazard vulnerability index by overlaying a series of maps. Classification hazard maps in 10 km grid can also be seen for three different hazards, namely the frequency of desertification, earthquake and aridity. According to Yusuf and Francisco [41-50], composite map was made according to the following formula:
Z=Xi – Ximin
Where Zi is the standardized hazards of type area; Xi is the unstandardized hazards of type area; Ximax is maximum value of the hazard in the area and Ximin is the minimum value of the hazard in the area.
In this study, weighted average of three standardized hazards was used and then all three hazards maps were overlaid onto a map with single-multiple hazard. This can be better observed in the following figure which illustrates the overall hazard map where three hazards of desertification, earthquake and aridity are combined.
Human Activities Sensitivity Maps
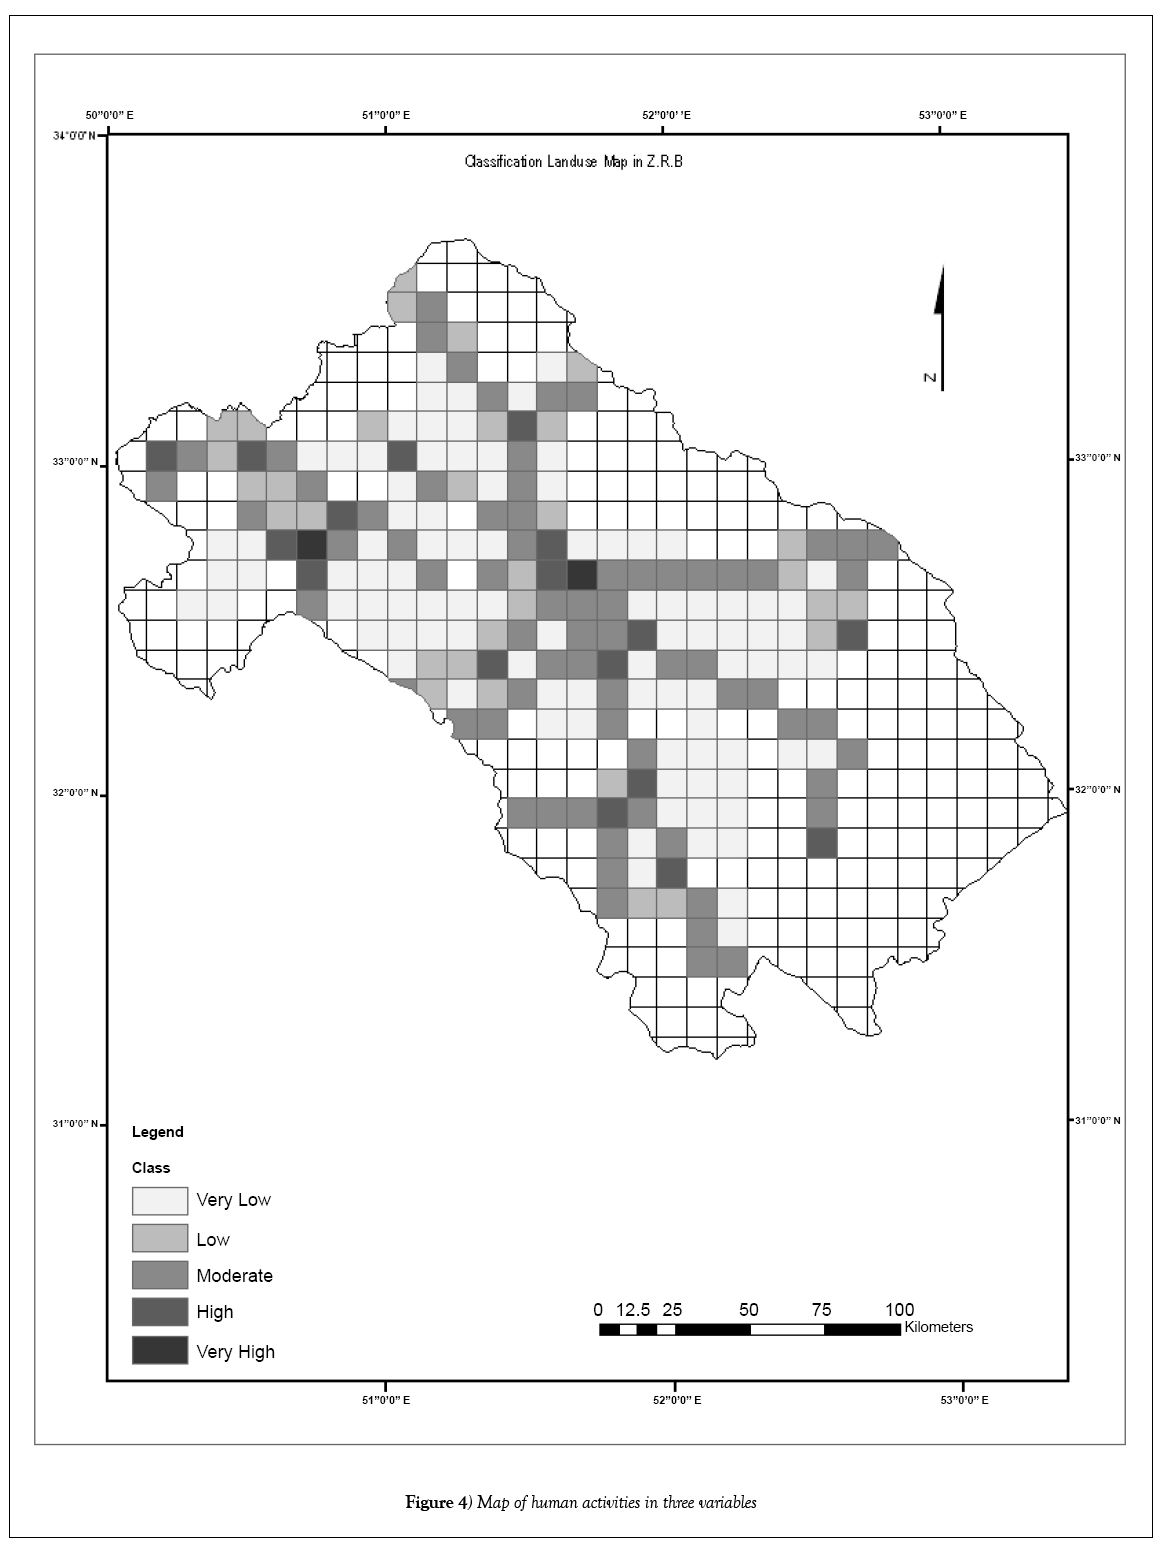
Urban and industrial maps were obtained from the Organization of Natural Resources in Isfahan, Iran [51-55]. These maps show locations of human variables. In this study, the variables were measured per square kilometer in grid map. The maps are produced based on weighted average for each variable and then sum of the value for final classification map is calculated (Figure 4).
The overall classification hazard maps with human and adaptive maps were derived using the weighted average of the standardized values for each of the 10 km grid. These classes are used in Figure 3. You need to explain properly for reader before or immediately after Figure 3.
As can be seen in Figure 4, the center of area has the highest density of human activities. Southern parts of the area have relatively more protected areas compared to other parts. The largest protected areas are located in the center.
Adaptive Capacity Map
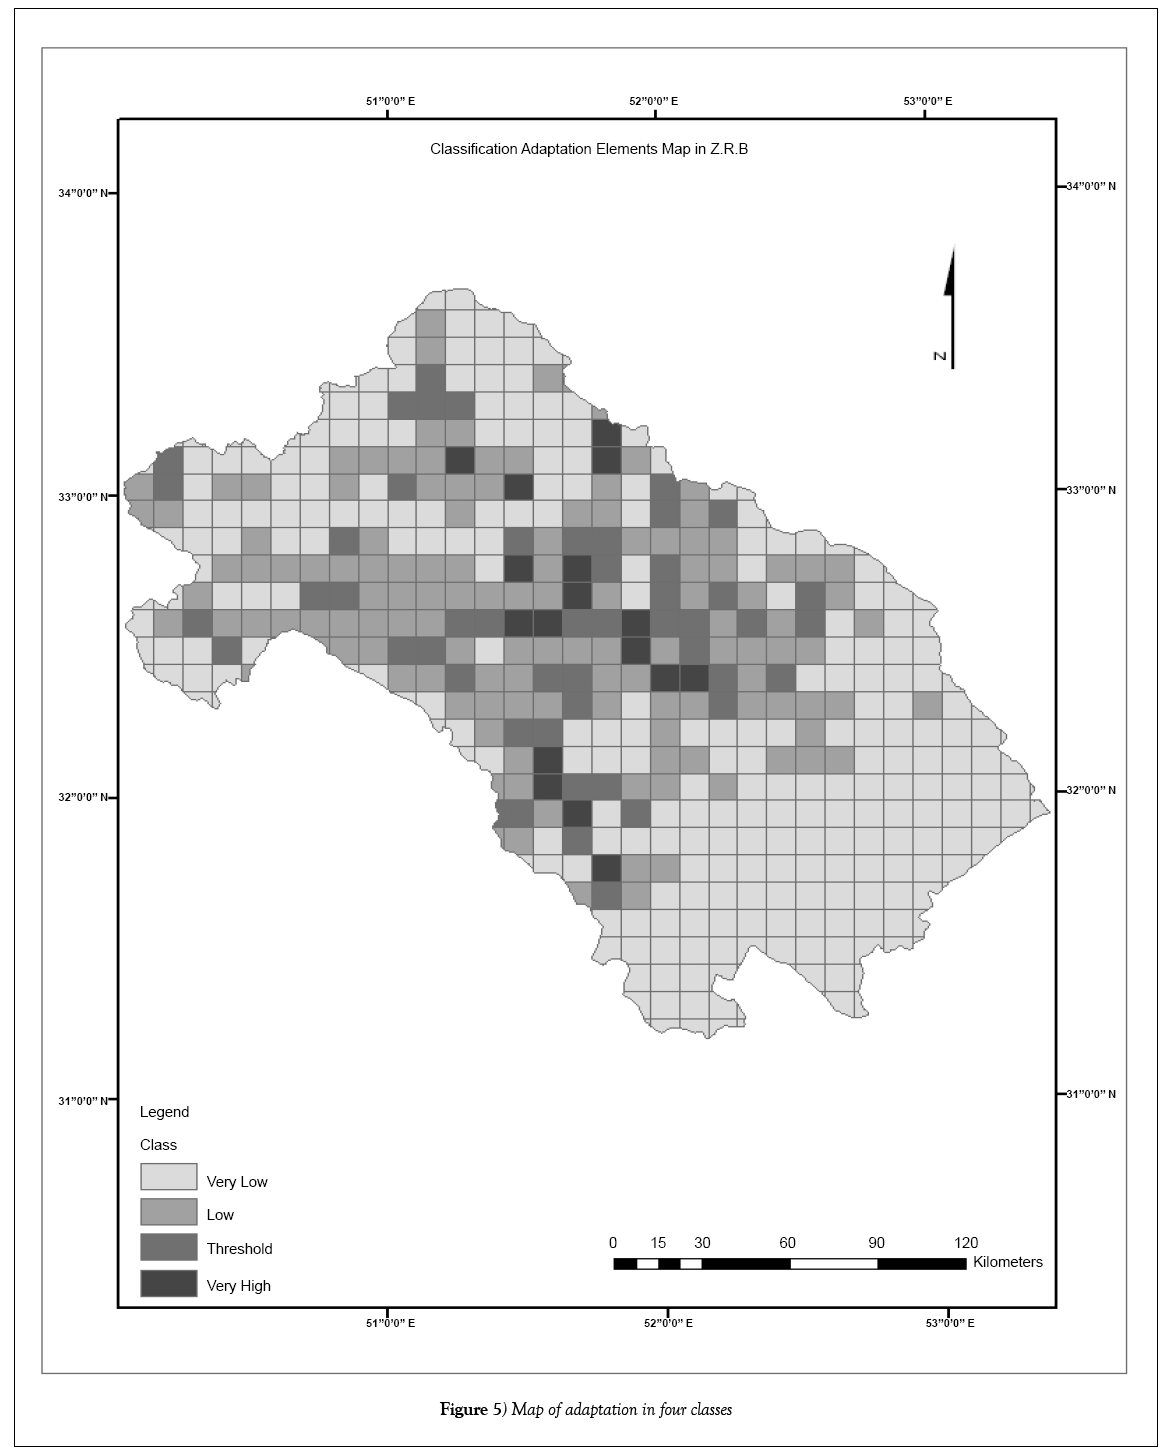
Several definitions have been proposed for Adaptive Capacity. For instance, it was defined by Yusuf and Francisco [56] as the degree to which adjustments in practices, processes or structures can moderate or offset potential damage or take advantage of opportunities. It can be written in equation form as follows: In this study, frequency of each of adaptation parameters were measured in 10 km grids. Then, classification and weighted were assigned to the various hazards (Figure 5).
Adaptive Capacity=f (medical area, technology, infrastructure)
Result and Discussion
Variables of human activities are predictors of stresses which might add to the vulnerability of hazards. The present findings indicated that the most vulnerable areas were North, West and South-West parts. In some previous studies, the composite hazard map has been drawn for disasters such as tsunami, earthquake, flood, etc. (OCHA Regional Office for Asia Pacific, 2011; United Nations Office for the Coordination of Humanitarian Affairs Regional Office for Asia and the Pacific, 2011) [57]. However, in this research composite hazards maps included the classification of earthquakes, desertification and aridity hazards. Additionally, composite hazard maps were utilized to show the critical center of the hazards in Zayandeh-Roud Basin. Finally, identification of the critical center of hazards can be useful for hazard management and prevention of hazards.
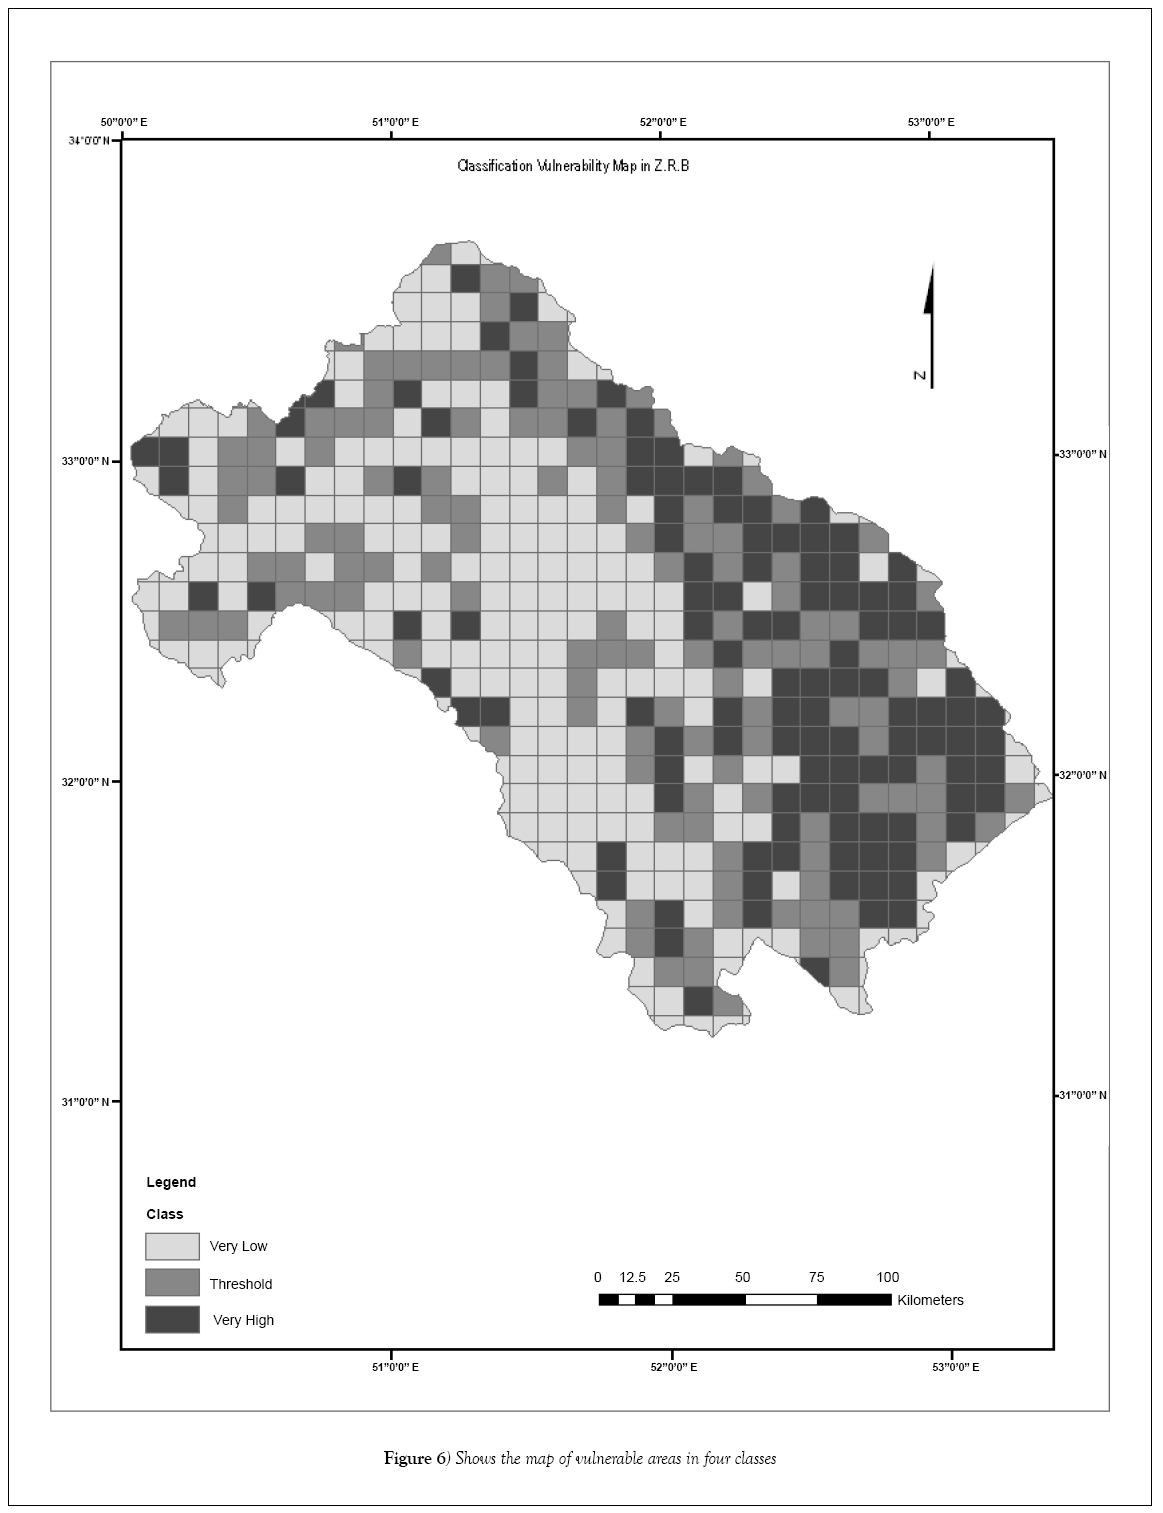
This paper also attempted to find out critical center of composite hazard by classification hazards map. The aim for this was two-fold; firstly, it aimed to evaluate and classify human activities and, secondly, to adapt the classified map. Human activities are urban, industrial and roads of Z.R.B. in form of classification density of human activities map. The highest vulnerable classes of human activities are located on Central, Southern and Northern parts of the basin. According to overlaying status of classification composite hazards map and density of human activities, high classes of human activities are located on class 1 and 2 of composite hazard map. Most of the adaptation parameters are located on the Center and South of the area. As it can be observed in Figure 6, vulnerable areas are located on the Eastern and Western parts of the basin. It is evident that these areas are far from high classes of human activities.
Distribution of vulnerability was obtained with the same symmetry with that of the hazards. By development of technology and building activities, it can be proposed that vulnerability was weak in the studied area. Figure 6 shows that very high classes of vulnerability were observed in Eastern and Northern parts of the area, while lower classes were observed in central spots of the basin. The reason for the latter can be adaptive parameters. It was indicated that vulnerability was not random in the area, because desertification and aridity depended on geographical conditions while earthquakes depended on tectonic conditions.
Conclusion
Evaluation of adaptation and vulnerability of composite hazards and density of human activities are the novel measures taken in this study. It was shown that adaptation and vulnerability can be measured to evaluate the situation of human activities. This can be done with the goal of identifying the classification hazards and composite of the hazards when order of priority is taken into account. As another conclusion to the present study, composite hazard map can benefit in hazard management by identifying critical center and evaluating vulnerability on classes of composite hazard map.
Vulnerability to the hazards is a threat to Z.R.B. This study can be a deemed as a pioneering step to understand the vulnerability and adaptive capacity of urban habitats to the hazard threats. Vulnerability of human activities is related to damages imposed on urban, industrial and roads within the area. When the hazards occur, houses, factories and roads are damaged. This study has highlighted the adaption ability with respect to hazards. In this study, adaptive measurement is different in that it incorporates locations and frequencies of places which can be of great help to humans during occurrence of hazards. Furthermore, this method would recognize situation of hazards, vulnerability and adaptive in micro-scale. This knowledge would be useful for further research made by geologists, engineers and management planners.
REFERENCES
- Askari KOA, Shayannejad M. Study of sensitivity of autumnal wheat to under irrigation in Shahrekord, Shahrekord City, Iran. Intern J Agricul Crop Sci. 2015;8(4):602-5.
- Shayannejad M, Akbari N, Askari KOA. Study of modifications of the river physical specifications on Muskingum coefficients, through employment of genetic algorithm. Intern J Develop Res. 2015;5(3):3782-5.
- Askari KOA, Shayannejad M. The reviews of Einstein’s equation of logarithmic distribution platform and the process of changes in the speed range of the Karkheh River, Khuzestan province, Iran. Intern J Develop Res. 2015;5(3):3786-90.
- Askari KOA, Shayannejad M, Ghorbanizadee HK. Assessment of artificial neural network performance and exponential regression in prediction of effective rainfall. Intern J Dev Res. 2015;5(3):3791-4.
- Shayannejad M, Akbari N, Askari KOA. Determination of the nonlinear Muskingum model coefficients using genetic algorithm and numerical solution of the continuity. Int J Sci Basic Appl Res. 2015;21(1):1-4.
- Askari KOA, Shayannejad M. The study of mixture design for foam bitumen and the polymeric and oil materials function in loose soils consolidation. J Civil Eng Res. 2015;5(2):39-44.
- Sayedipour M, Askari KOA, Shayannejad M. Recovery of run off of the sewage refinery, a factor for balancing the Isfahan-Borkhar plain water table in drought crisis situation in Isfahan Province-Iran. Am J Environ Eng. 2015;5(2):43-6.
- Askari KOA, Shayannejad M. Developing an optimal design model of furrow irrigation based on the minimum cost and maximum irrigation efficiency. Intern Bull Water Res Dev. 2015;3(2):18-23.
- Askari KOA, Shayannejad M. Presenting a mathematical model for estimating the deep percolation due to irrigation. Intern J Hydra Eng. 2015;4(1):17-21.
- Askari KOA, Shayannejad M. Usage of rock fill dams in the HEC-RAS software for the purpose of controlling floods. Am J Fluid Dyn. 2015;5(1):23-9.
- Raeisi HV, Soltani ART, Askari KOA, et al. The effect of heterogeneity due to inappropriate tillage on water advance and recession in furrow irrigation. J Agric Sci. 2015;7(6):127-36.
- Soltani ART, Raeisi HV, Shayannejad M, et al. Effects of magnetized municipal effluent on some chemical properties of soil in furrow irrigation. Intl J Agri Crop Sci. 2015;8(3):482-9.
- Askari KOA, Shayannejad M. Optimal design of pressurized irrigation laterals installed on sloping land. Intl J Agric Crop Sci. 2015;8(5):792-7.
- Askari KOA, Shayannejad M, Eslamian S, et al. Comparison of solution of saint-venant equations by characteristics and finite difference methods for unsteady flow analyzing in open channel. Int J Hydrol Sci Technol. 2016;6(3):9-18.
- Askari KOA, Shayannejad M, Eslamian S, et al. Deficit irrigation: Optimization models. Management of Drought and Water Scarcity. 2017;3:373-89.
- Eskandari S, Hoodaji M, Tahmourespour A, et al. Bioremediation of polycyclic aromatic hydrocarbons by Bacillus licheniformis ATHE9 and Bacillus mojavensis ATHE13 as newly strains isolated from oil-contaminated soil. J Geogr Environ Earth Sci Int. 2017;11(2):1-1.
- Raeisi HV, Shayannejad M, Soltani ART, et al. Development of a new method for determination of infiltration coefficients in furrow irrigation with natural non-uniformity of slope. Sustain Water Resour Manag. 2017;3(2):163-9.
- Shojaei N, Shafaei MB, Eslamian S, et al. Assessment of drainage slope on the manning coarseness coefficient in mountain area. Int J Constr Res Civ Eng. 2017;3(1):33-40.
- Bahmanpour H, Awhadi S, Enjili J, et al. Optimizing absorbent bentonite and evaluation of contaminants removal from petrochemical industries wastewater. Int J Constr Res Civ Eng. 2017;3(2):34-2.
- Shayannejad M, Eslamian S, Gandomkar A, et al. A proper way to install trapezoidal flumes for measurements in furrow irrigation systems. Intl J Res Stud Agric Sci. 2017;3(7):1-5.
- Dehghan S, Kamaneh SAA, Eslamian S, et al. Changes in temperature and precipitation with the analysis of geomorphic basin chaos in Shiraz, Iran. Int J Constr Res Civ Eng. 2017;3(2):50-7.
- Askari KOA, Shayannejad M. Flood routing in rivers by muskingum’s method with new adjusted coefficients. Int Water Technol J. 2016;6(3):189-94.
- Askari KOA, Shayannejad M, Ghorbanizadeh-Kharazi H. Artificial neural network for modeling nitrate pollution of groundwater in marginal area of Zayandeh-Roud River, Isfahan, Iran. KSCE J Civil Eng. 2017;21(1):134-40.
- Vulnerability Mapping for southeast Asia. Economy and Environment Program for Southeast Asia (EEPSEA).
- Liu B, Siu YL, Mitchell G. Hazard interaction analysis for multi-hazard risk assessment: A systematic classification based on hazard-forming environment. Natl Hazards Earth Syst. 2016;16:629-42.
- Master plan for the rehabilitation and development of agriculture reports by consulting engineers, natural resources organization of Isfahan, Iran (Persian). Consultant Engineering. 2014.
- Surface water resources reports in Govkhooni, Yazd and Ardestan area. Water and Soil Research Organization of Isfahan, Iran (Persian). Consultant Engineering. 1997;126.
- Ivan B, Lidija TS. Contemporary approach for management of water related natural hazards in mountainous regions. Ohrid, Republic of Macedonia. 2010.
- Janet E, Martin G, Barbro NL, et al. EU Asia Pro Eco project disaster reduction through awareness, preparedness and prevention mechanisms in coastal settlements in Asia, Swedish Rescue Services Agency Janet Edwards, EU and International Affairs Department. 2007.
- Marani MB, Khairulmaini OS. Desertification risk mapping of the Zayandeh-Roud Basin in Iran. J Earth Syst Sci. 2013;122(5):1269-82.
- United Nations Office. The coordination of humanitarian affairs regional office for Asia and the Pacific. OCHA Regional Office for Asia Pacific. 2011.
- Saatsaz M, Sulaiman WNA, Eslamian SS. GIS drastic model for groundwater vulnerability estimation of Astaneh-Kouchesfahan Plain, Northern Iran. Int J Water. 2011;6(1&2):1-4.
- Dalezios NR, Tarquis AM, Eslamian S. Environmental hazards methodologies for risk assessment and management. Droughts. 2017;5:177-210.
- Dalezios NR, Eslamian S. Environmental hazards methodologies for risk assessment and management. 2017.
- Gaaloul N, Eslamian S. Artificial recharge experiences in semiarid areas. Environ Hydrol Water Manag. 2014;2(3):17-49.
- Gaaloul N, Eslamian S, Laignel B, et al. Contamination of groundwater in arid and semiarid lands. Drought and Water Scarcity. 2017;2:291-314.
- Rahman A, Hajani E, Eslamian S. Rainwater harvesting in arid regions of Australia. Drought and Water Scarcity. 2017;26:489-500.
- Mukherjee S, Yadav K, Eslamian S. Soil contaminations in arid and semiarid land. Drought and Water Scarcity. 2017;2:547-56.
- Gaaloul N, Eslamian S. Artificial recharge experiences in semiarid areas. Eng Hydrol. 2014;3(3):17-49.
- Zarei AR, Eslamian S. Trend assessment of precipitation and drought index (SPI) using parametric and non-parametric trend analysis methods. Int J Hydrol Sci Technol. 2017;7(1):12-38.
- Amiri MJ, Hamidifar H, Bahrami M, et al. Optimisation of deficit-irrigation under variable seasonal rainfall and planning scenarios for rice in a semi-arid region of Iran. Int J Hydrol Sci Technol. 2016;6(4)331-43.
- Kamali MI, Nazari R, Faridhosseini A, et al. The determination of reference evapotranspiration for spatial distribution mapping using geostatistics. Water Resour Manag. 2015;29:3929-40.
- Ghazavi R, Vali AB, Eslamian S. Impact of flood spreading on groundwater level variation and groundwater quality in an arid environment. Water Resour Manag. 2012;26(6):1651-63.
- Eslamian SS, Khordadi MJ, Abedi KJ. Effects of variations in climatic parameters on evapotranspiration in the arid and semi-arid regions, global and planetary change. 2011;78:188-94.
- Eslamian SS, Lavaei N. Modelling nitrate pollution of groundwater using artificial neural network and genetic algorithm in an arid zone. Int J Water. 2009;5(2):194-203.
- Eslamian SS, Feizi H. Maximum monthly rainfall analysis using l-moments for an arid region in Isfahan Province, Iran. J Appl Meteorol Climatol. 2007;46(4):494–503.
- Amiri MJ, Eslamian SS, Abedi JK, et al. Estimation of daily pan evaporation using the fuzzy regression method in a semi-arid region of Iran. 10th Iranian Conference on Fuzzy Systems, Shahid Beheshti University, Tehran, Iran. 2010;300-4.
- Moravejolahkami B, Eslamian SS. Application of two-step and FAO-56 evapotranspiration models in an arid environment. IWA World Water Congress and Exhibition, Montreal, Canada. 2010.
- Mirabbasi R, Eslamian SS. Delineation of groundwater quality concerning applicability of pressure irrigation system in Sirjan watershed, Iran. International Conference on Management of Soil and Groundwater Salinization in Arid Regions, Sultan Qaboos University, Muscat, Oman. 2010.
- Eslamian SS, Amiri MJ, Balderer W. A review on thermal spring in iran, groundwater, thermal and mineral water in areas of arid conditions: Consequences for the current situation of climate change and the increasing population of Egypt. IAH-CMTW Workshop, Cairo, Egypt. 2009.
- Eslamian SS, Khordadi MJ, Baba Ahmadi A, et al. Effects of variations in climate parameters on evapotranspiration in the arid and semiarid regions. 2009.
- Biabanaki M, Eslamian SS. Comparing regional flood and low flow frequency by index flood and hybrid methods. International Conference on Human Impacts on Soils Quality Attributes in Arid & Semiarid Regions, Isfahan University of Technology, Esfahan, Iran. 2005.
- Eslamian SS, Khatoonabadi SA, Shahidi Hamadani AR, et al. Water resources mismanagement and desertification of a semiarid region, Gahavand plain. Seventh International Conference on Dry Land Development, Tehran, Iran. 2003.
- Nosrati K, Mohseni Saravi M, Eslamian SS, et al. Identification of homogeneous regions in hydrological drought using multivariate statistical techniques in arid and semi-arid zones. Third Regional Conference and First National conference on Climate Change, University of Isfahan, Isfahan, Iran. 2003.
- Eslamian SS, Khajedin SJ, Amiri AM. Role of dam construction in developing desert regions of arid zone climates. 8th International Conference on Understanding Future Dryland Environmental Changes from Past Dynamics, Yazd University, Iran. 2002.
- Chavoshi S, Eslamian SS. The role of traditional utilization of water in management of water resources of arid land. Second Regional Conference on Water and Wastewater Management in Asia, Tehran, Iran. 2001.
- Chavoshi SB, Eslamian SS. Regional flood analysis in arid zones using hybrid method. Water Wastewater J. 1999;30:23-35.


