Anti-diabetic effects of fungal polysaccharides extracted from pholiota adipose
2 Academy of Medical, Changchun Sci-Tech University, Changchun, China, Email: liuff_1981_2006@163.com
3 Key Laboratory of Medicinal Fungal Resources and Development and Utilization, Jilin Agricultural University, Changchun, China
Received: 05-Feb-2022, Manuscript No. PULHHR-22-4174; Editor assigned: 07-Feb-2022, Pre QC No. PULHHR-22-4174; Accepted Date: Feb 22, 2022; Reviewed: 18-Feb-2022 QC No. PULHHR-22-4174; Revised: 20-Feb-2022, Manuscript No. PULHHR-22-4174; Published: 28-Feb-2022, DOI: 10.37532/ pulhhr.22.6(2).57-63
This open-access article is distributed under the terms of the Creative Commons Attribution Non-Commercial License (CC BY-NC) (http://creativecommons.org/licenses/by-nc/4.0/), which permits reuse, distribution and reproduction of the article, provided that the original work is properly cited and the reuse is restricted to noncommercial purposes. For commercial reuse, contact reprints@pulsus.com
Abstract
BACKGROUND: Pholiota adiposa is a valuable edible and medicinal fungus.
METHODS: In this study, we aimed to investigate the anti-diabetic effects of the polysaccharides extracted from Pholiota Adiposa (PAP) by the method of water extraction and alcohol precipitation on streptozotocin-induced diabetic ICR male mice. PAP was analyzed by LS-MS method. Relevant biochemical indicators were detected by ELISA assay, hematoxylin-eosin staining (H & E), Fasting Glucose Levels (FBG), Oral Glucose Tolerance Test (OGTT), tissue homogenate biochemical measurements, immunohistochemical staining and western blot.
RESULTS: The results revealed that the PAP is a neutral polysaccharide composed of d-fructose, d-mannose, dextrose anhydrate, d-xylose, trehalose, and galactose. And the PAP treatment groups exhibited a significant reduction in FBG levels, the HD group was about 10 mmol/L lower than the DC group, and increase in body weight, the HD group weighed about 5 gm more than the DC group on average. Also, the levels of Triacylglycerol (TG), Total Cholesterol (TC), and Low-Density Lipoprotein-Cholesterol (LDL-C) were found to be decreased, while the levels of high-density Superoxide Dismutase (SOD), Lipoproteincholesterol (HDL-C), catalase (CAT), and Glutathione Peroxidase (GSH-Px) were increased in the PAP treatment groups. The pancreatic and liver sections of Diabetic Control group (DC) exhibited several histopathological changes, but the PAP treatment groups exhibited improvements. PAP treatment led to the significant restoration of islet morphology and function. Moreover, the results of the western blot analysis indicate that PAP could be used for the treatment of diabetes, since it modifies part of the IRS1/ PI3K/ AKT signaling pathway.
Keywords
Pholiota adipose; T2DM; Biochemical; histopathological; Immunohistological; Western blot
Introduction
As we know, diabetes is a serious metabolic disorder disease, the main cause of which is due to the modern dietary pattern, and Type 2 Diabetes Mellitus (T2DM) is a metabolic disorder that has become a major threat to public health all over the world [1,2]. Its main manifestations are dyslipidemia, glucose intolerance, elevated blood pressure and insulin resistance. However, Type 2 Diabetes Mellitus (T2DM) impaired glucose tolerance and low-grade inflammation and the main clinical manifestations of it are polydipsia, polyuria, polyphagia and weight loss, accompanied by high blood and urine glucose level [3]. The total number of diabetic patients worldwide would have been estimated to increase from 171 million in 2000 to 592 million in 2030 was according to the International Diabetes Federation (IDF) [4].
Nowadays, there are several antidiabetic drugs available, such as metformin, glibenclamide, acarbose and rosiglitazone, but which are harmful to the organs, such as the liver and kidney [5]. Rosiglitazone plays a role in lowering blood glucose by increasing the sensitivity of skeletal muscle, liver and adipose tissue to insulin and improving the utilization of glucose by cells and it can significantly reduce fasting blood glucose, insulin and C-peptide levels, as well as postprandial blood glucose and insulin, but on October 27, 2017, the World Health Organization International Agency for Research on Cancer announced the list of carcinogens, and rosiglitazone was included in the list of three carcinogens [5]. Fungal polysaccharide is an effective medicinal ingredient, it has a variety of medicinal values, such as anti-tumour, lowering blood sugar, improving immunity, etc [6]. Many studies have been done in past in search of fungal polysaccharides to treat diabetes, such as Agaricus bisporus, but still, there is the quest for a better and more effective antidiabetic one [7].
Pholiota adiposa is an edible medicinal fungus that grows on willow trees in Northeast Asia [8]. P. adiposa, an edible mushroom widely cultivated in China, is rich in proteins, essential amino acids, dietary fiber, trace elements, vitamins, and carbohydrates [9]. Extracts from the fruiting bodies of P. adiposa demonstrate a variety of functions, such as antitumor, antimicrobial and antioxidative activities, phenolic compounds from mushrooms, including esters with phenolichy droxyl groups, exhibit antioxidant activity which may be related to their ability to chelate metals, inhibit lipoxygenase, and scavenge free radicals. In this research, we evaluated the therapeutic effect of the polysaccharide of P. adiposa (PAP) on diabetes and the related mechanism.
Materials and Methods
Materials
The fruits of P. adiposa were purchased from Songyuan City, Changchun, China, and were identified by Professor Tolgor Bau of Jilin Agricultural University as Pholiota adiposa. The specimen of P. adiposa was preserved in the strains library of fungi diversity laboratory which is attached to the engineering research center of the Chinese ministry of education for edible and medicinal fungi at Jilin agricultural university. In this study, all chemical reagents used were of analytical grade. Streptozotocin (STZ) was used to generate a T2DM mouse model (Saint Louis, Missouri, USA). Rosiglitazone was used as a positive control medicine (Salvage Co., Ltd., Guizhou). The reagent kits for High-Density Lipoprotein Cholesterol (HDL-C), Low-Density Lipoprotein Cholesterol (LDL-C), Glutathione Peroxidase (GSH-Px), Superoxide Dismutase (SOD), Triacylglycerol (TG), and Total Cholesterol (TC) were used for assessing the serum levels of the respective biochemical indexes (R&D Co., Ltd. Minneapolis, MN, USA). Antibodies against PI3K, p-AKT, AKT, GSK3β, p-GSK3β, IRS1, and p-IRS1 were used to detect the respective proteins (Cell Signaling Technology, Beverly, MA, USA).
PAP Extraction
The samples of P. adiposa were dried at 55°C, and after complete drying, they were ground and passed through a 60 mesh sieve. The SZC-101 Soxhlet extractor was used to remove the fat from the samples that were dried in an oven at 40°C thereafter. Then, 300 gm of powder was suspended in 5 Litre of water, boiled for 4 hours, and then the extracted mixture was centrifuged (4000 × gm for 10 minutes) to collect the supernatant, and the extraction was repeated thrice. Moreover, the Sevage method was used to remove the protein by conducting eight cycles of deproteinization using 5:1(v/v) CHCl3- n-BuOH. PAP was obtained after purification using Sephadex G-50, and then it was lyophilized for further use.
Animals and experimental protocol
All animal experiments were approved by the Institutional Animal Care and Use Committee of the Ethical Committee for Laboratory Animals at Jilin Agricultural University (Permit No. ECLA-JLAU-18048). Specific pathogenfree grade six-to eight-week-old male ICR mice weighing 20 gm ± 2 gm were purchased from Liaoning Changsheng Biotechnology Co., Ltd. (Liaoning, China) with Certificate No.: SCXK (Liao) 2018-0001. The mice were fed with a standard laboratory diet and water ad libitum at a temperature of 25 ± 2°C with 12-hours light/dark cycle, and all mice were adapted to this environment for at least one week [10].
Animals and experimental protocols
The experimental ICR mice were randomly divided into five groups with 10 mice in each group: the PAP treatment group was treated orally and divided into high dose group (HD, PAP at a dose of 300 mg/kg/day), and low dose group (LD, PAP at a dose of 100 mg/kg/day) groups; and the others were Normal Control group (NC, without STZ induction), diabetic control group (DC, 0.9% NaCl solution in a matched volume), and the Positive Control group (PC) was in traperitoneally injected with rosiglitazone (PC, rosiglitazone at a dose of 2 mg/kg per day) [11,12].
NC mice had free access to water and standard chow. T2DM mice were fed a high sugar and fat diet (basal diet, 77% regular diet, 15% egg yolk powder, 10% lard oil, 5% white sugar, 2% cholesterol, 0.2% sodium cholate, and 0.7% salt) for 4 weeks. Subsequently, T2DM mice were intraperitoneally injected with 80 mg/kg freshly prepared STZ solution in 0.1 mol/L citrate buffer (pH=4.5) twice within 72 hours during the 5th week. When the Fasting Blood Glucose (FBG) level reached over 11.1 mmol/L, the mice were considered T2DM mice.
Fasting glucose levels
The blood samples were obtained from the tail vein of the mice after 72 hours of injection. The blood samples of each group were collected from the tail vein after fasting for 6 hours, and the FBG levels of all mice were evaluated using a glucometer for 5 weeks. For the next 4 weeks, the mice were intragastrically administered, body weights were measured once daily, and plasma glucose was assessed using a Glucose Colorimetric Assay Kit (Jiancheng Bioengineering Institute, Nanjing, China).
Oral Glucose Tolerance Test (OGTT)
Approximately 24 hours before the animal dissection experiment, all mice fasted for 12 hours. Subsequently, glucose (Salvage Pharmaceutical Co., Ltd. Guizhou, China) was administered at a dose of 2 g/kg in the mice of each group. Then, the blood samples were collected from the tail vein, and the glucose levels were determined at 0, 30, 60, 90, and 120 minutes. The calculation formula used is as follows: Area Under Curve (AUC)=(c0+c1) × (t1−t0) × 1/2+ (c1 + c2) × (t2 − t1) × 1/2…, where t represents the time point and c represents the plasma glucose level.
Tissue homogenate biochemical measurements
All mice were euthanized after overnight fasting. In this step, one part of the liver (1 gm) was homogenized in 9 mL of buffer containing Tris-HCl (10 mM), sucrose (0.25 mM), EDTA (1 mM), and dithiothreitol (Jiancheng Bioengineering Institute, Nanjing, China) (1mM) at pH 7. The tissues were homogenized through centrifugation at 3000 × gm for 10 min to obtain the supernatant, which was used to determine CAT, SOD, and GSH-Px activities, and hepatic glycogen levels. The glycogen level in the skeletal muscle samples was determined according to the manufacturer’s instructions.
Serum biochemical parameters measurements
Freshly heparinized blood was prepared and centrifuged at 1000 × gm for 20 minutes. The samples of each group were stored at 4°C for further biochemical assays. The liver, pancreas, kidney, thymus, and spleen were collected. The pancreas was cleaned with saline and fixed with 10% formalin for histological analysis. Following the procedures described in the commercial kit, TG, TC, HDL-C, and LDL-C levels of the mice were determined using the ELISA assay [13].
Histopathological analysis
The liver and pancreatic tissues of each mouse were removed and fixed in 10% neutral buffered formalin for 24 hours. The tissue samples were dehydrated and embedded in paraffin. Each block was sectioned (5 μm) throughout its length. The sections were stained with Hematoxylin and Eosin (H & E). The H & E staining results of the tissues are shown as color images captured at 400× magnification under an optical microscope (Olympus, Japan).
Expression analysis of insulin and glucagon in islet cells using immunohistological analysis
Immunohistochemical analysis was performed as described previously [12]. A portion of the pancreatic tissue samples from the pancreatic body region was fixed in 4% paraformaldehyde for 24 hours at room temperature and then embedded in paraffin. Each block was sectioned (3 μm) throughout its length. The sections were then co-stained with the anti-glucagon antibody and the other sections were co-stained with the anti-insulin antibody. Images were captured under a fluorescence microscope equipped with a charge-coupled device camera (Olympus, Japan). The expression of insulin and glucagon in islet cells was evaluated based on the cell sequence, cell integrity, number of nuclei, size of necrotic area, positive cell count, and staining intensity score.
Western blot analysis
The liver tissues were lysed using the RIPA lysis buffer at 4°C for 30 minutes, and the total protein concentration was assessed using the BCA assay kit (Pierce, Rockford, IL). Proteins were separated using 15% sodium dodecyl sulfate-polyacrylamide gels (SDS-PAGE) and transferred onto the Polyvinylidene Fluoride (PVDF) membranes. The membranes were incubated with the corresponding primary antibodies at 4°C overnight followed by the corresponding secondary antibodies. Finally, the Enhanced Chemiluminescence (ECL) reagent was added and proteins were observed using an enhanced chemiluminescence detection system (Amersham Pharmacia Biotechnology, Tokyo, Japan).
Evaluation of polysaccharide content
P. Adiposa Polysaccharide (PAP) content was evaluated using the phenol-sulfuric acid method [14]. Thereafter, to analyze the composition of the polysaccharide ingredients of P. adiposa by Liquid Chromatography-Tandem Mass Spectrometry (LC-MS/MS) technology in the positive and negative ion mode.b3, 1200 HPLC-TOF/MS (Bruker Daltonics), 1200 HPLC (Agilent Technology), and the chromatographic fingerprint was obtained using a Diamonsil II C18 column (250 mm × 4.6 mm, 5 μm) and gradient elution with 0.05% H2O-formic acid (A)-acetonitrile (B) at a flow rate of 1.0 mL/min. The column temperature was maintained at 35°C.
Statistical analysis
All data are presented as mean ± Standard Deviation (S.D.). The significant difference between the groups was determined using the one-way analysis of variance (ANOVA) followed by Duncan’s test, and statistical significance was set at p<0.05. Statistical analyses were performed using the SPSS version 22.0.
Results
Body weight changes
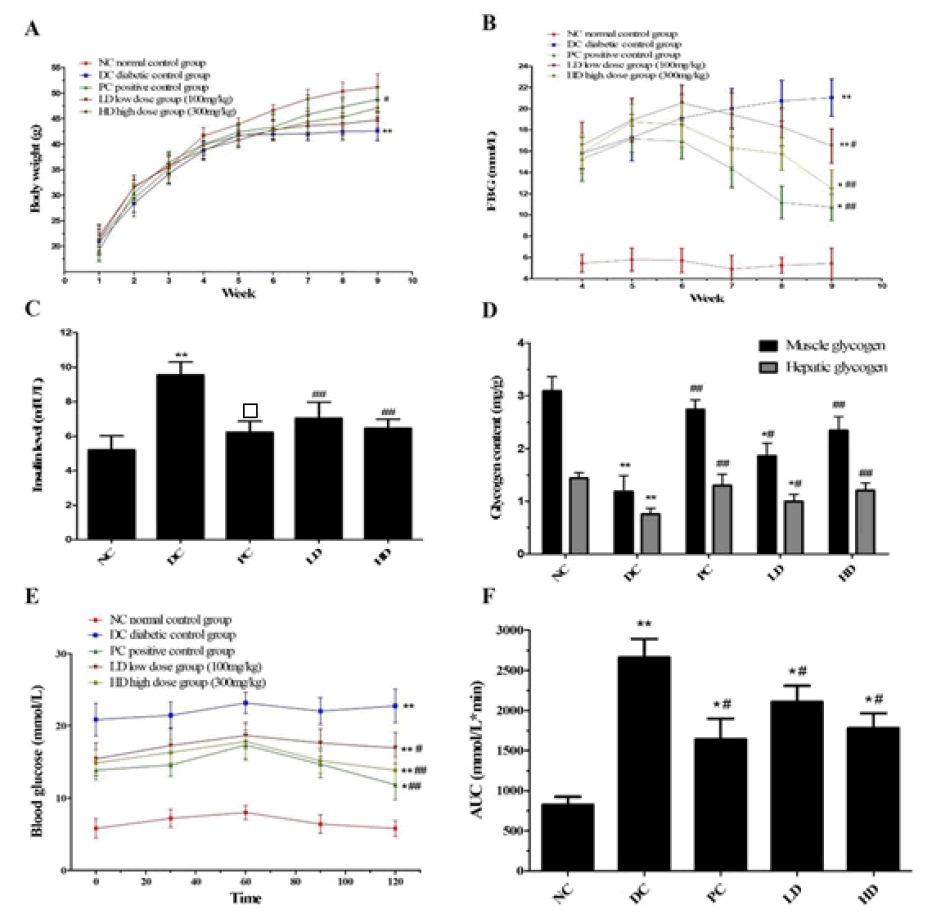
Loss of body weight is an indicator of type 2 diabetes. During the experimental phase, the diabetic mice were simulated using a combination of a high-fat diet and low-dose STZ injection, and a diverse variation in body weight was observed. The mice in the T2DM group exhibited a significantly lower body weight gain (p<0.05) than the NC group, which may be attributed to the abnormal metabolism of structural proteins (Figure 1). After 4 weeks of PAP administration, the PAP treatment groups exhibited a significant weight gain, especially the HD group (p<0.05), compared to the DC group.
Changes in fasting blood glucose levels
Compared to the NC group, the fasting blood glucose level significantly increased after STZ injection, and all groups exhibited fasting blood glucose levels higher than 11.1 mmol/L, except the NC group. Therefore, the mice were considered T2DM mice. Thereafter, T2DM mice were subjected to PAP treatment for 4 weeks, and the fasting glucose level in the LD, HD, and PC groups decreased significantly when compared to the DC group (p<0.05) (Figure 1).
Figure 1: (A) Effects of Pholiota Adipose Polysacchride (PAP) treatment on body weight (B) Effect of PAP treatment on fasting blood glucose levels (C) Effects of PAP treatment on insulin level in T2DM mice (D) Effects of PAP treatment on glycogen level in T2DM mice (E) Oral Glucose Tolerance Test (OGTT) level (F) corresponding area under curve level of OGTT.*p<0.05 and **p<0.01 compared with the NC group, #p<0.05 and ##p<0.01 compared with the DC group
Effects of PAP on glycogen and insulin levels
Insulin plays an important role in maintaining blood glucose homeostasis. All T2DM mice exhibited a significant increase in insulin levels, especially in the DC group. The insulin levels in the PAP treatment groups (both LD and HD) exhibited a significant decrease compared to the DC group in a dosedependent manner (Figure 1).
Glycogen is an important factor involved in maintaining blood glucose homeostasis, whereas T2DM leads to a decrease in glycogen storage. All T2DM mice exhibited significantly lower hepatic and muscle glycogen levels than the NC group (Figure 1). However, compared to the DC group, the PAP treatment groups exhibited recovery of both hepatic and muscle glycogen levels.
Result of OGTT
The results of the OGTT analysis are shown in Figure 1. OGTT levels in T2DM mice improved in a dose-dependent manner in the PAP treatment groups. Moreover, the OGTT level in the HD group was more similar to that in the DC group, which exhibited a slightly better effect (p < 0.05).
Effect of PAP on antioxidant enzymes activities in liver
The supernatant of the liver homogenate was obtained at 4°C, which was then subjected to an ELISA test to investigate the activities of antioxidant enzymes in the liver. In this experiment, during T2DM analysis, the activities of GSH-Px, SOD, and CAT in the supernatant of liver homogenates of diabetic mice were found to be significantly decreased in all groups except the NC group. However, after PAP treatment for 4 weeks (from 5 weeks to 9 weeks), the activities of GSH-Px, SOD, and CAT increased significantly compared to the DC group (Table 1). Therefore, PAP exerted a significant effect on alleviating oxidative stress by increasing the activities of antioxidant enzymes, such as GSH-Px, SOD and CAT.
TABLE 1 Effects of Pholiota Adiposa Polysaccharide (PAP) on activities of antioxidant enzyme in liver
| Component name | NC | DC | PC | LD | HD |
|---|---|---|---|---|---|
| CAT (U/mg) | 64.83 ± 3.18 | 34.26 ± 5.05** | 54.29 ± 3.84*## | 43.07 ± 5.50**# | 48.63 ± 3.96**## |
| SOD (U/mg) | 420.17 ± 26.54 | 226.87 ± 44.72** | 380.68 ± 33.25*## | 327.14 ± 29.16**## | 375.48 ± 41.96*## |
| GSH-Px (U/mg) | 580.75 ± 46.52 | 380.73 ± 33.10** | 505.86 ± 35.27**## | 457.28 ± 42.18**## | 487.03 ± 44.86**## |
*p<0.05, **p<0.01 compared with the NC group, #p<0.05, ##p<0.01 compared with the DC group |
|||||
Effect of PAP on serum biochemical parameters
Insulin deficiency directly or indirectly links T2DM and causes abnormal lipid metabolism. In a previous study, the abnormal lipid metabolism was generally manifested as TC ≥ 5.18 mmol/L, TG ≥ 1.7 mmol/L, HDL-C < 1.04 mmol/L, and LDL-C ≥ 3.37 in serum. In this study, the changes in lipid levels (including TC, TG, LDL-C, and HDL-C) in the serum of normal and T2DM mice were investigated. The results are shown in Table 2, which indicate obvious changes in the lipid profiles of STZ-induced T2DM mice compared to the NC group mice. Moreover, upon PAP treatment of T2DM mice for 4 weeks, the levels of TC, TG, and LDL-C in T2DM mice, but not the HDL-C levels, decreased significantly (p<0.05), especially in the HD group, compared to the NC group. However, the symptoms did not recover completely.
TABLE 2 Effects of Pholiota Adiposa Polysaccharide (PAP) on serum lipid profiles
| Component name | NC | DC | PC | LD | HD |
|---|---|---|---|---|---|
| TC (mmol/L) | 4.69 ± 0.70 | 8.40 ± 0.76** | 5.06 ± 0.94## | 6.07 ± 0.76*## | 5.59 ± 0.57*## |
| TG (mmol/L) | 1.34 ± 0.17 | 2.37 ± 0.36** | 1.55 ± 0.19## | 1.86 ± 0.31**## | 1.64 ± 0.21*## |
| HDL-C (mmol/L) | 1.56 ± 0.13 | 0.79 ± 0.13** | 1.36 ± 0.17*## | 1.19 ± 0.16**## | 1.26 ± 0.15*## |
| LDL-C (mmol/L) | 0.75 ± 0.18 | 3.44 ± 0.73** | 2.50 ± 0.52**## | 3.29 ± 0.38** | 2.81 ± 0.76**# |
| *p < 0.05, **p < 0.01 compared with the NC group, #p < 0.05, ##p<0.01 compared with the DC group.
|
|||||
Effects of PAP on histopathological changes in liver and pancreas tissues
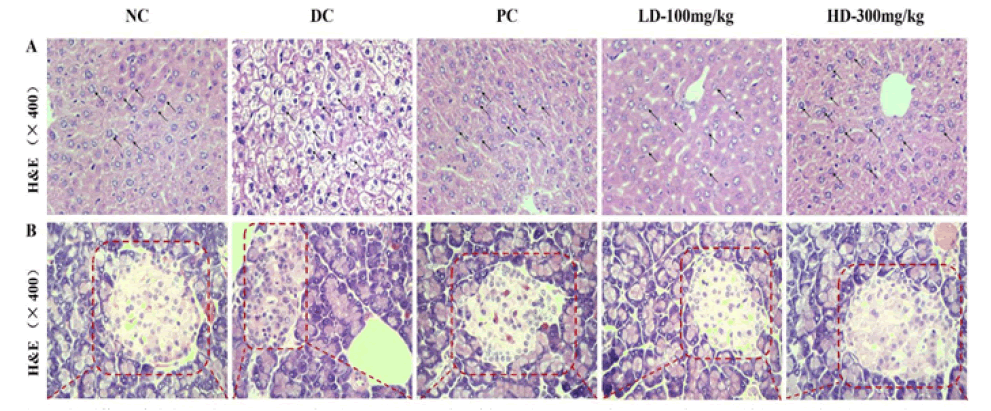
The H & E stained sections of the liver are shown in Figure 2; the NC group exhibited normal liver tissue, and hepatocytes were neatly arranged with a clear nucleus located in the center. However, there were some histopathological changes in the hepatic tissue of T2DM mice, and the hepatocytes exhibited a loose arrangement and a large necrotic region. In this study, the PAP treatment groups exhibited a physiol effect on the pathological changes in the liver caused by STZ compared to the DC group.
Figure 2: Effects of Pholiota Adipose Polysacchride (PAP) on the protection of liver and pancreas against damages in Type 2 Diabetes Mellitus (T2DM) mice (A) Pathological detection of liver tissues was performed by Hematoxylin-Eosin (H&E) staining of histologic section (400×) (B) Pathological detection of pancreatic tissues were performed by Hematoxylin-Eosin (H&E) staining of histologic section (400×)
It is known that normal insulin secretion is determined based on the structure and number of islet cells in the pancreas. The H&E staining results of the pancreas are shown in Figure 2. The NC group mice exhibited a regular pancreatic islet structure with a well-defined boundary filled with clear and normal islet cells that were neatly arranged. Conversely, the distribution of cells in pancreatic islets was irregular with partly diseased nuclei, and the outline of the pancreas islets was indistinct in the DC group mice. Moreover, many normal islet cells were retained in the PAP treatment groups probably to maintain the pancreatic islet function. Therefore, the above results indicate that PAP might protect the liver and repair the injured pancreatic islet cells.
3 Immunohistochemistry and immunofluorescence analysis
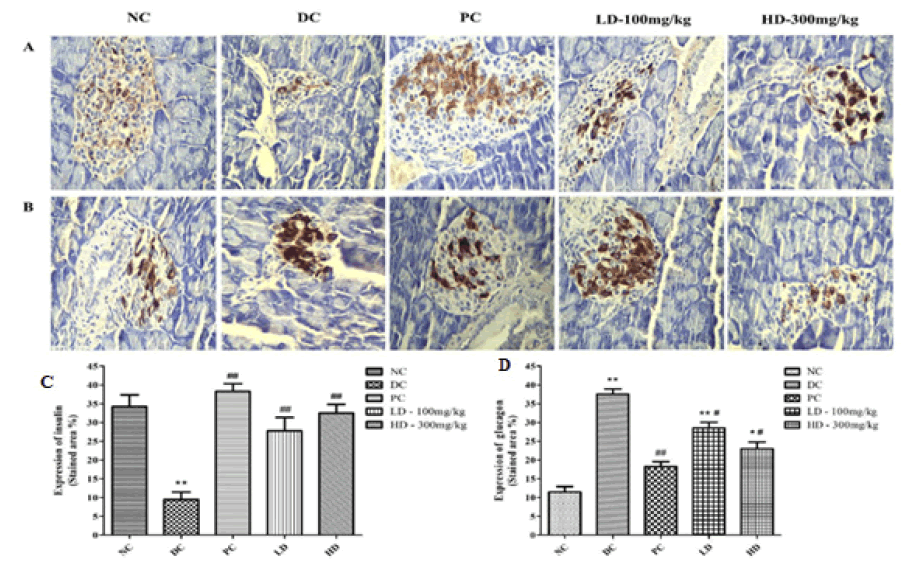
As shown in Figure 3, in the NC group mice, the insulin-expressing cells were evenly dyed and spread across the whole area of the pancreatic islets, and the outline of the pancreatic islet was clear. However, in the pancreatic islets of the DC group mice, the expression of insulin was found to be decreased and the pancreatic islet shape was irregular. After PAP treatment, the symptoms improved in both the LD and HD groups, wherein the insulin expression was found to be increased and the outline became clear.
Figure 3: (A) Expression of insulin in islets cells by immunohistological analysis (400×) (B) Expression of glucagon in islets cells by immunohistological analysis (400×) (C) Shows the graphical representation of the expression of insulin in islets cells (D) Shows the graphical representation of the expression of glucagon in islets cells. *p<0.05 and **p<0.01 compared with the Normal Control (NC) group, #p<0.05 and ##p<0.01 compared with the Diabetic Control (DC) group
Glucagon expression is shown in Figure 3. In NC group mice, glucagonexpressing cells were distributed at the edge of the pancreatic islet, away from the center, which exhibited low expression. However, in the DC group, the number of glucagon-expressing cells was high in the whole pancreatic islet, especially in the central region. However, the amount of glucagon expression in cells was significantly decreased in the PAP treatment group mice and moved away from the center of the pancreatic islet.
Effects of PAP on the expression of PI3K, AKT, p-AKT, p-IRS1, IRS1, GSK3β, and p-GSK3β
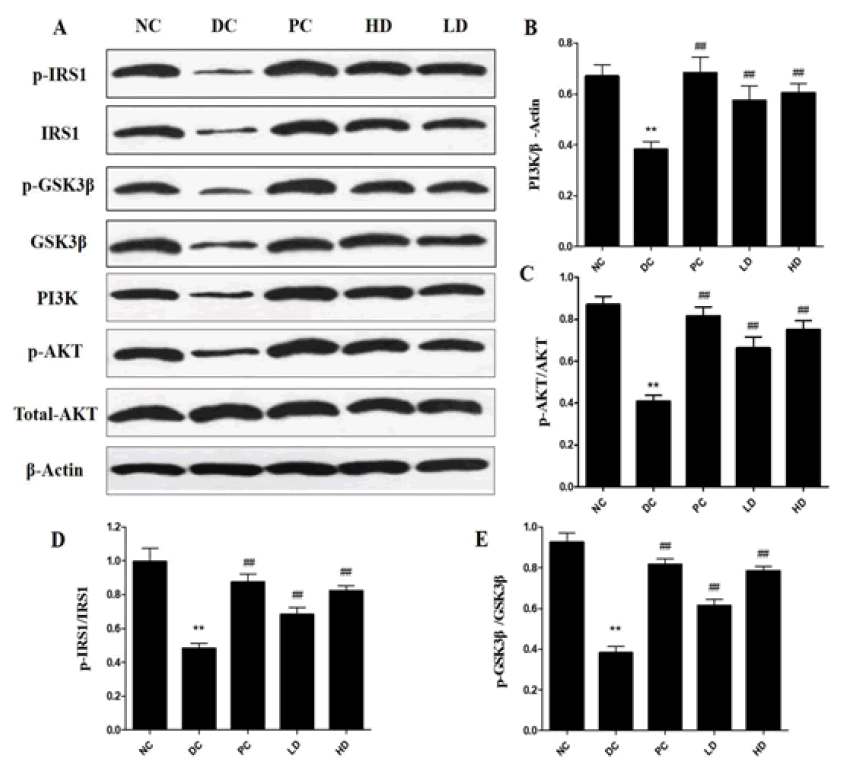
The expression of PI3K and p-AKT was significantly decreased in the DC group (p<0.01) (Figure 4). The expression of PI3K and p-AKT in the PAP treatment groups was significantly increased, especially in the HD group. Without any changes in the total Akt protein level, Akt phosphorylation in the PAP treatment groups (LD and HD) was significantly increased compared to the DC group. Additionally, PAP treatment significantly recovered theexpression of p-IRS1and p-GSK3β in the liver of the PAP treatment groups (LD and HD) (p<0.01).
Figure 4: (A) Effects of Pholiota Adipose Polysacchride (PAP) on the expression of p-IRS1, IRS1, PI3K, p-AKT, AKT, GSK3β and p-GSK3βin liver of Type 2 Diabetes Mellitus (T2DM) mice (B) Shows the graphical representation of the effects of Pholiota Adipose Polysacchride (PAP) on the expression of PI3K/β-Actin (C) Shows the graphical representation of the effects of Pholiota Adipose Polysacchride (PAP) on the expression of p-AKT/AKT (D) Shows the graphical representation of the effects of Pholiota Adipose Polysacchride (PAP) on the expression of p-IRS1/IRS1 (E) Shows the graphical representation of the effects of Pholiota Adipose Polysacchride (PAP) on the expression of p-GSK3β/GSK3β
LS-MS/MS analysis of PAP
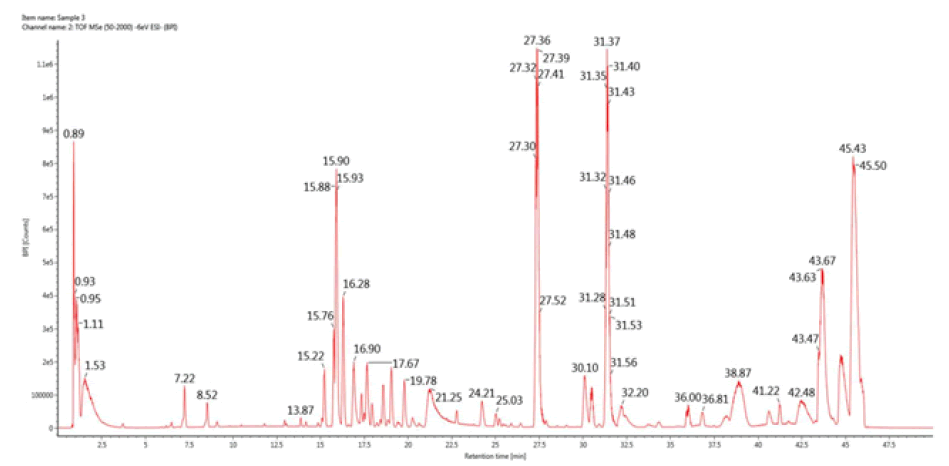
As shown in Figure 5, in the present study, under optimal chromatographic and MS conditions, six carbohydrate components were identified, including D-fructose, D-mannose, dextrose anhydrate, d-xylose, trehalose, and galactose. Therefore, we can assume that PAP extracted from P. adiposa is composed of these six components. Meanwhile, the results indicated that the proportion of trehalose was significantly higher than the other carbohydrates, which was concluded based on the peak area (Table 3).
TABLE 3 Affiliation of key peaks of Pholiota Adiposa Polysaccharide (PAP).
| Peak | Component name | RT (min) | Expected mass (Da) | Observed m/z | Formula | Mass error (mDa) | Adducts | Peak area |
|---|---|---|---|---|---|---|---|---|
| 1 | D-fructose | 0.89 | 180.0634 | 179.05502 | C6H12O6 | -1.09 | -H | 36310 |
| 2 | D- Mannose | 0.93 | 182.07904 | 181.07101 | C6H14O6 | -0.75 | -H, +HCOO | 35720 |
| 3 | D-extrose Anhydrate | 0.95 | 180.06339 | 179.05524 | C6H12O6 | -0.87 | -H | 23248 |
| 4 | D-xylose | 1.11 | 150.05282 | 195.05023 | C5H10O5 | -0.83 | +HCOO, -H | 30535 |
| 5 | Trehalose | 1.53 | 342.11621 | 377.08383 | C12H22O11 | -1.78 | +Cl, -H, |
707343 |
| 6 | D-Galactose | 17.67 | 489.19586 | 524.16685 | C20H31N3O11 | -1.59 | +Cl | 12923 |
Discussion
In recent years, medicinal fungi, such as Inonotus obliquus, Cordyceps militaris, and Pleurotus citrinopileatus, have increasingly attracted the attention of researchers for their potent anti-diabetic effects [15-17]. It is important to study the pharmacology of the fungal polysaccharides, which are beneficial to humans [18]. The activities of PAP were found to exert immunomodulatory and antitumor effects [10], as well as antiproliferative effects on the macrophages, and splenocytes, thereby increasing the life-span in sarcoma-bearing mice [10,15]. In this study, the hypoglycemic mechanism of PAP was investigated.
T2DM causes abnormal glucose metabolism, leading to weight loss in T2DM mice [19]. After 4 weeks of PAP treatment, the PAP treatment groups exhibited a significant weight gain, especially the HD group (p<0.05). Conversely, the PAP treatment groups exhibited improved glucose tolerance as the FBG and OGTT levels decreased. Therefore, these results suggest that PAP can improve glucose homeostasis and insulin resistance in T2DM mice.
Insulin resistance in diabetes is linked to excessive glucose output and a decrease in glycogen synthesis. The muscles and liver play an important role in maintaining the blood glucose homeostasis, balancing the uptake, storage, and production of glucose via glycogenesis, glycogenolysis, and gluconeogenesis; however, T2DM reduces glycogen storage, causing a reduction in the body’s insulin levels, which can then lead to an increase in blood glucose levels. In this study, using PAP treatment, liver glycogen and muscle glycogen levels were recovered, which helped promote glycogen synthesis via increasing the insulin sensitivity in the liver and muscles to reduce the blood glucose levels in the body.
Dyslipidemia is an important marker of T2DM. After PAP treatment of T2DM mice for 4 weeks, the levels of TC, TG, and LDL-C in T2DM mice decreased significantly, and HDL-C levels increased significantly (p<0.05). Therefore, the results indicated that the decrease in TC and TG levels might be partially due to the increase in HDL-C levels [20]. Therefore, PAP can act as a promising candidate for modulating lipid metabolism in T2DM mice.
In T2DM mice, the increase in the levels of reactive oxygen species has been shown to induce oxidative damage in the pancreas and liver, thereby resulting in elevated blood glucose levels. In this study, the activities of GSHPx, SOD, and CAT were significantly lower in the DC group than in other groups. PAP treatment enhanced the antioxidant capacity by inducing GSHPx,
SOD, and CAT activities in vivo [21].
H&E staining was performed for the histopathological examination of the liver and pancreas [12]. The results suggested that PAP exhibited the ability to protect the liver and repair the injured pancreatic islet cells via increasing the activities of antioxidant enzymes. The results of the immunohistochemical analysis revealed that, after PAP treatment of T2DM mice, the number of insulin-expressing cells increased, the islet area expanded, the contour was clear, and the number of glucagon-expressing cells decreased significantly. The results indicated that, upon PAP treatment, the pancreatic islets in T2DM mice were protected, as the insulin level increased and the glucagon level decreased, thereby reducing the blood glucose level [22].
The insulin signaling pathway plays a key role in improving insulin resistance, and the PI3K pathway plays a key role in mediating insulin metabolism [23,24]. The stimulation of the PI3K/AKT signaling pathway is always accompanied by the alleviation of insulin resistance [25]. Akt is a downstream molecule of PI3K, which regulates a series of downstream molecules, including GSK3β [22]. GSK3β is regulated by insulin in the insulin signaling pathway, which is involved in the anabolism of liver sugar. Therefore, the phosphorylation of GSK3β induced by AKT is correlated with the increase in glycogen synthesis [24]. Conversely, the Insulin Receptor (InsR) mediates the insulin reaction upstream of PI3K, which activates the PI3K/AKT pathway. Insulin exerts its action through binding to InsR in the liver, which further stimulates tyrosine-phosphorylated IRS1/2. The results of the western blot analysis revealed that PAP treatment increased the expression of p-IRS1, PI3K, p-AKT, and p-GSK3β without altering the total protein levels of Akt in T2DM mice, which further indicated that the IRS1/PI3K/AKT signaling pathway is partly mediated via the hypoglycemic effects of PAP.
Conclusion
Pholiota adiposa possess several physiological activities, and the polysaccharide of P. Adiposa (PAP) exhibited antitumor activity in vivo by promoting apoptosis, mediating inflammatory responses, and inhibiting angiogenesis. In this research, the PAP treatment groups exhibited a significant reduction in FBG levels and an increase in body weight. Also, the levels of TG, TC, and LDL-C were found to be decreased, while the levels of high-density SOD, HDL-C, CAT, and GSH-Px were increased in the PAP treatment groups. The pancreatic and liver sections of DC exhibited several histopathological changes, but the PAP treatment groups exhibited improvements. PAP treatment led to the significant restoration of islet morphology and function. Moreover, with the results obtained in this research, PAP could be used for the treatment of diabetes, since it modifies part of the IRS1/PI3K/AKT signaling pathway. In this research, the PAP could be used as an effective ingredient to prevent and cure diabetes.
Acknowledgments
The authors are grateful for the National Science and Technology Foundation Project (JJKH20220397KJ). We declare that there are no financial or other contractual agreements that might cause conflicts of interest or be perceived as causing conflicts of interest.
Conflicts of Interest
There are no conflicts to declare.
REFERENCES
- Duru KC, Kovaleva EG, Danilova IG, et al. The pharmacological potential and possible molecular mechanisms of action of inonotus obliquus from preclinical studies. Phytother Res. 2019;33(8):1953-2138.
Google Scholar Cross Ref - Reshetnikov SV, Wasser SP, Nevo E, et al. Medicinal value of the genus Tremella Pers. (Heterobasidiomycetes)-a review. Int J Med Mushrooms. 2000;2:169-193.
Google Scholar Cross Ref - Podell BK, Ackart DF, Richardson MA, et al. A model of type 2 diabetes in the guinea pig using sequential diet-induced glucose intolerance and streptozotocin treatment. Dis Model Mech. 2017;10(2):151-162.
Google Scholar Cross Ref - Okin D, Medzhitov R. The effect of sustained inflammation on hepatic mevalonate pathway results in hyperglycemia. Cell. 2016;165(2):343-356.
Google Scholar Cross Ref - Liu L, Yasen M, Tang D, et al. Polyphenol-enriched extract of Rosa rugosa Thunb regulates lipid metabolism in diabetic rats by activation of AMPK pathway. Biomed Pharmacother. 2018;100:29-35.
Google Scholar Cross Ref - Chen Y, Gu XH, Huang SQ, et al. Optimization of Ultrasonic/ Microwave Assisted Extraction (UMAE) of polysaccharides from Inonotus obliquus and evaluation of its anti-tumor activities. Int J Biol Macromol. 2010;46(4):429-435.
Google Scholar Cross Ref - Yamac M, Kanbak G, Zeytinoglu M, et al. Pancreas protective effect of button mushroom Agaricus bisporus (J.E. Lange) Imbach (Agaricomycetidae) extract on rats with streptozotocin-induced diabetes. Int J Med Mushrooms. 2010;12(4):379-89.
Google Scholar Cross Ref - Zou YJ, Du F, Hu QX, et al. The structural characterization of a polysaccharide exhibiting antitumor effect from Pholiota adiposa mycelia. Sci Rep. 2019;9(1):1724.
Google Scholar Cross Ref - Kim MJ, Chang WB, Lee KW, et al. Cultural characteristics of Pholiota adiposa according to substrates composition of sawdust medium by bottle cultivation. J Mushroom. 2015;13(1):21-25.
Google Scholar Cross Ref - Wang XY, Bao HY, Bau T. Investigation of the possible mechanism of polysaccharides extracted from Leucocalocybe mongolica in exerting antitumor effects in H22 tumor-bearing mice. J Food Biochem. 2021;e13514.
Google Scholar Cross Ref - Stage TB, Christensen MH, Jorgensen NR, et al. Effects of metformin, rosiglitazone and insulin on bone metabolism in patients with type 2 diabetes. Bone. 2018;122:35-41.
Google Scholar Cross Ref - Lo HC, Tu ST, Lin KC, et al. The anti-hyperglycemic activity of the fruiting body of Cordyceps in diabetic rats induced by nicotinamide and streptozotocin. Life Sci. 2004;74(23):2897-2908.
Google Scholar Cross Ref - Balaji P, Madhanraj R, Rameshkumar K, et al. Evaluation of antidiabetic activity of Pleurotus pulmonarius against streptozotocin nicotinamide induced diabetic wistar albino rats. Saudi J Biol Sci. 2020;27(3):913-924.
Google Scholar Cross Ref - Wu XC, Xiao Y, Yan WG, et al. The human oncogene SCL/TAL1 interrupting locus (STIL) promotes tumor growth through MAPK/ ERK, PI3K/Akt and AMPK pathways in prostate cancer. Gene. 2018;686:220-227.
Google Scholar Cross Ref - Xue J, Tong SS, Wang ZR, et al. Chemical characterization and hypoglycaemic activities in vitro of two polysaccharides from inonotus obliquus by submerged culture. Molecules. 2018;23(12):3261.
Google Scholar Cross Ref - Yu SH, Dubey NK, Li WS, et al. Cordyceps militaris treatment preserves renal function in type 2 diabetic nephropathy mice. Plos One. 2016;11(11):e0166342.
Google Scholar Cross Ref - Freitas AC, Antunes MB, RodriguesD, et al. Use of coffee by-products for the cultivation of pleurotus citrinopileatus and pleurotus salmoneo-stramineus and its impact on biological properties of extracts thereof. Int J Food Sci Technol. 2018;53(8):1914-1924.
Google Scholar Cross Ref - Klaus A, Kozarski M, Niksic M, et al. The edible mushroom laetiporus sulphureus as potential source of natural antioxidants. Int J Food Sci Nutr. 2013;64(5):599-610.
Google Scholar Cross Ref - Liu F, Ng TB, Wang HX, et al. Lectin from tricholoma mongolicum S. Imai (Agaricomycetideae) mycelia stimulates gene expression of immunomodulating cytokines in mmouse peritoneal macrophages and splenocytes. Int J Med. Mushrooms. 7: 243-248.
Google Scholar Cross Ref - Chen SD, Yong TQ, Zhang YF, et al. Inhibitory effect of five ganoderma species (Agaricomycetes) against Key digestive enzymes related to type 2 diabetes mellitus. Int J Med Mushrooms. 2019;21(7):703-711.
Google Scholar Cross Ref - Muhammad AS, Reanmongkol W, Radenahmad N, et al. Antihyperglycemic and anti-hyperlipidemic effects of rhinacanthinsrich extract from Rhinacanthus nasutus leaves in nicotinamidestreptozotocin induced diabetic rats. Biomed Pharmacother. 2019;113:108702.
Google Scholar Cross Ref - Li WS, Chang M, Qiu M, et al. Exogenous obestatin decreases beta-cell apoptosis and alfa-cell proliferation in high fat diet and streptozotocin induced type 2 diabetic rats. Eur J Pharmacol 2019;851(15):36-42.
Google Scholar Cross Ref - Fan YB, He ZW, Wang W, et al. Tangganjian decoction ameliorates type 2 diabetes mellitus and nonalcoholic fatty liver disease in rats by activating the IRS/PI3K/AKT signaling pathway. Biomed Pharmacother. 2018;10:733-737.
Google Scholar Cross Ref - Ho CK, Sriram G, Dipple KM. Insulin sensitivity predictions in individuals with obesity and type II diabetes mellitus using mathematical model of the insulin signal transduction pathway. Mol Genet Metab. 2016;119(3):288-292.
Google Scholar Cross Ref - Mustafa Y, Melih Z, Hakan S, et al. Effects of black hoof medicinal mushroom, phellinus linteus (Agaricomycetes), polysaccharide extract in streptozotocin-induced diabetic rats. Int J Med Mushrooms. 2016;18(4): 301-311.
Google Scholar Cross Ref


