Assessment of diastolic wall strain in heart failure patients with mid-range ejection fraction
Received: 16-Jan-2019 Accepted Date: Feb 22, 2019; Published: 01-Mar-2019
Citation: ELSaidy MA, Abdalaal MA, Elsheikh AA. Assessment of Diastolic Wall Strain in Heart Failure Patients with Mid-Range Ejection Fraction. J Heart Res 2019;2(1):1-6.
This open-access article is distributed under the terms of the Creative Commons Attribution Non-Commercial License (CC BY-NC) (http://creativecommons.org/licenses/by-nc/4.0/), which permits reuse, distribution and reproduction of the article, provided that the original work is properly cited and the reuse is restricted to noncommercial purposes. For commercial reuse, contact reprints@pulsus.com
Abstract
Background: Diastolic wall strain (DWS), is a new marker for determining diastolic function and has been used as a marker of abnormal mechanics of the heart.
Aim of the work: To determine the feasibility and reproducibility of measuring DWS in heart failure mid-range ejection fraction and compare it to the other groups of Heart Failure (HF), and to define its relation with other parameters determining cardiac structure and function.
Methods: 624 HF were classified into 3 groups according to the Ejection Fraction (EF): group 1 included 209 patients with reduced EF, group 2; 150 patients with mid-range EF, and group 3, 265 patients with preserved EF. They were compared to 30 normals, group 4. Full echocardiographic examination of systolic and diastolic indices was performed. DWS was measured as follows: {posterior systolic wall thickness (PWs)-posterior wall diastolic thickness (PWd)}/PWs.
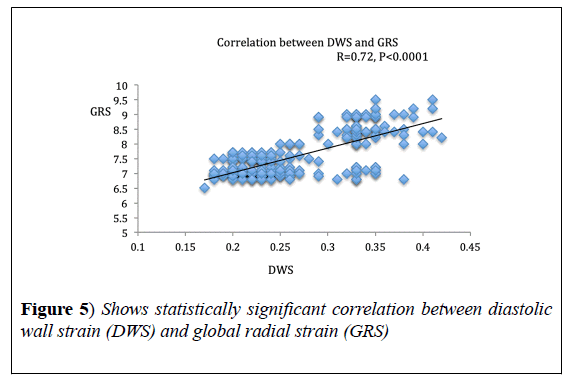
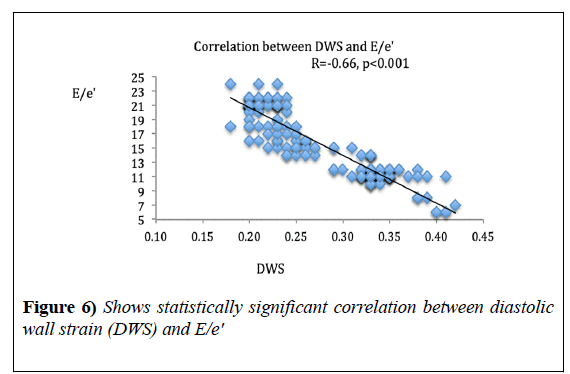
Results: DWs was significantly lower in HF groups as compared to normal subjects; 0.21 ± 0.02, 0.24 ± 0.026 and 0.32 ± 0.03, in groups 1, 2 and 3 respectively, while it was 0.4 ± 0.02 in the control group, p<0.0001. It correlated significantly with Myocardial Performance Index (MPI), r=-0.81, p<0.0001, global radial strain, r=0.72, p<0.0001 and E/e', r=-0.66, p<0.001.
Conclusion: Measurement of DWS is feasible and reproducible in HF patients. It was significantly low in HF patients, and appears to reflect overall myocardial performance.
Keywords
Diastolic wall strain; Heart failure; Myocardial performance
Introduction
Diastolic wall strain (DWS) as derived from echocardiography is a noninvasive, load-independent, and a reproducible estimator of LV stiffness. It is an extension of the linear elastic theory which conveys that; decreased wall thinning during diastole reflects reduced compliance and distensibility of the LV, and thus, increased LV stiffness [1]. DWS is a new marker for the determination of the diastolic function and has been used as a marker of abnormal mechanics of the heart [2]. It was found to have prognostic impact in patients at risk for heart failure [3], with heart failure reduced ejection fraction (HFrEF) [4], and heart failure preserved ejection fraction (HFpEF) [5]. Patients with heart failure mid-range ejection fraction (HFmrEF), have predominantly mild systolic dysfunction, associated with features of diastolic dysfunction [6]. Yet, there is a paucity of data about DWS in patients with (HFmrEF).
Aim
We aimed to determine the feasibility, and reproducibility of measuring DWS in patients with (HFmrEF), compare it to the other two groups of heart failure, and to define the relation between DWS and other parameters determining cardiac structure and function.
Methods
Study population
This is a cross sectional cohort study including patients seen or admitted in our cardiology department with the diagnosis of chronic heart failure. They were recruited from March 2016 to December 2018. The study was approved by the local ethics committee, and all patients and normal subjects signed written informed consent. We included all patients with HF symptoms and signs based on Framingham criteria [7], with N-terminal prohormone brain natriuretic peptide (NT-proBNP) >125 pg/ml and at least one extra criterion: left ventricular hypertrophy (LVH), left atrial dilatation or diastolic dysfunction.
Heart failure patients were classified into 3 groups according to LVEF [6]: [Group 1, HFrEF with EF <40%, group 2, HFmrEF with EF 40-49%, and group 3, HFpEF with EF ≥ 50%, and compared to group 4, healthy controls]. The control subjects (without hypertension, diabetes mellitus (DM), obesity, or known cardiovascular illness) were identified from a random sample of age- and sex- matched patients coming for echocardiography in the same period.
All conditions associated with diastolic dysfunction such as hypertrophic cardiomyopathy, infiltrative cardiac disease, constrictive pericarditis, and restrictive cardiomyopathy were excluded from the study. Patients with valvular heart disease, cor pulmonale or dysrhythmia were excluded as well. Patients having wall motion abnormality involving the left ventricular posterior wall were also excluded. Grading of patient’s symptoms was done based on the NYHA classification [8]. Full laboratory investigation including NT-pro-BNP level was done. Electrocardiography (ECG) was recorded at a 25 mm/s speed. Interpretation of the ECG was done by a skilled investigator. Left ventricular hypertrophy (LVH) was diagnosed based on Sokolow index [9].
Echocardiographic examination was done using Vivid 9 (GE Healthcare, Horten, Norway). Data were stored and analyzed off-line using EchoPAC software (version 112, GE, Horten, Norway). Two independent investigators analyzed the data blinded to clinical data. Routine chamber quantification was performed according to ASE guidelines [10], and we estimated the LV mass by using the area/length formula and normalized it by the patient’s body surface area. LV hypertrophy was defined as an LV mass index >95 g/m2 for women and 115 g/m2 for men.
Also, left ventricular geometry either concentric or eccentric hypertrophy was determined as well [10]. By using speckle tracking echocardiography, the components of LV strain (longitudinal, radial and circumferencial) were analyzed, with the frame rate set at 50 per second, endocardial and epicardial border tracings were manually adjusted to optimize tracking. Peak longitudinal strains from the 16 LV segments were derived from the apical four-chamber, apical two-chamber and long axis views, and were automatically averaged to LV global longitudinal strain (GLS) [11].
ELSaidy et al
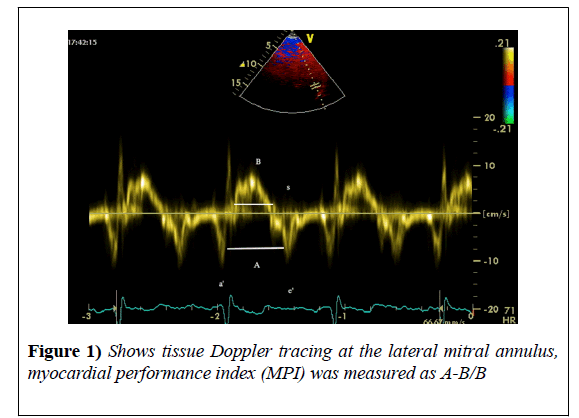
Also, global radial (GRS) and circumferential strain (GCS) were automatically averaged from parasternal short axis view. For ease of display, circumferential and GLS were converted into absolute values. We measured the parameters of the diastolic function; then diastolic dysfunction was classified into grades from one to four according to 2009 ASE guidelines [12]. Myocardial performance index (MPI) was measured from tissue Doppler imaging as follows:
A 1.5 mm sample volume was used. It was placed at the lateral mitral annulus in the apical-four chambers view. The pulsed-wave TDI tracings were recorded at a sweep speed of 100 mm/sec. and three of them were used for calculation [13].
It was calculated as follows:
MPI=A-B/B, where A: the distance between a' (tissue Doppler a'wave) and e' (tissue Doppler e'), and B: duration of the S wave (Figure 1).
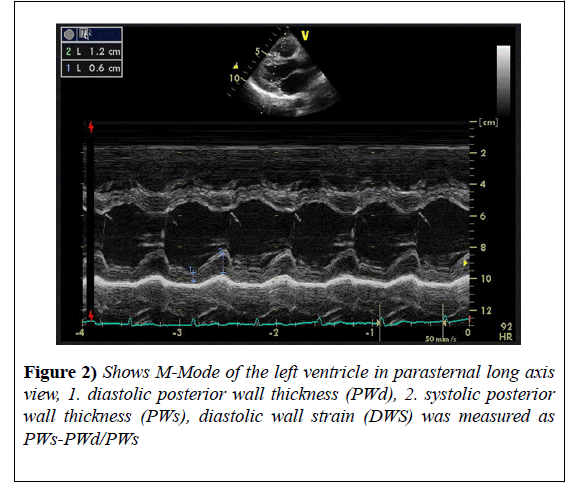
DWS was measured from parasternal long axis view in M-Mode as follows:
The left ventricular end systolic posterior wall thickness (PWs) and left ventricular end diastolic wall thickness (PWd) were measured. Then, DWS was calculated by the following formula:
DWS = (PWs-PWd)/PWs [1]. Three measurements were taken and the average was calculated (Figure 2).
Intra- and inter-observer agreement: Echocardiographic measurements were repeated in 20 randomly selected cases by the same investigator in order to analyze the intra-observer agreement and they were also measured by a second investigator in order to analyze the inter-observer agreement. The readers used the same cycle and they were blinded to previous measurements.
Statistical analysis
All analyses were performed using IBM SPSS 23, and Excel spread sheet, MS office 2011. Continuous variables were presented as means ± standard deviations. Categorical variables were presented as counts and percentages. ANOVA was used to compare variables among the four groups and Chi-squared test to compare categorical variables. Pearson correlation formula was used to correlate different parameters with DWS. The inter and intra-observer variability has been expressed as coefficient of variability (CV). The CV was calculated as SD of the differences divided by the mean of the variable under consideration. Differences were considered statistically significant when a P-value <0.05.
Result
We included 631 heart failure patients but, 7 patients were excluded from the study as they had bad echo window, so a total of 624/631 (98%) patients were included in the study, and classified into 3 groups according to LVEF: [Group 1 (N=209), HFrEF with EF <40%, group 2 (N=150), HFmrEF with EF 40-49%, and group 3 (N=265) HFpEF with EF ≥ 50%, and compared to group 4 (N=30) healthy controls].
General characteristics
Patients with HFrEF were significantly younger than the other two groups and had significantly more ischemic heart disease (IHD) when compared to HFmrEF (70 vs. 50%, p=0.002) and HFpEF (70 vs. 10%, p=0.0002). HFmrEF patients had more significant IHD as compared to HFpEF (50 vs. 10%, p=0.002).
Compared to group 1, women constituted most of the patients in groups 2 and 3 and had higher prevalence of diabetes and hypertension.
Patients in groups 2 and 3, had higher body mass index (BMI) and suffered more comorbidities including; chronic renal disease, thyroid disease, anemia, peripheral artery disease, and cerebrovascular accidents (Table 1).
| G1 (HFrEF) | G2 (HFmrEF) | G3 (HFpEF) | G4 (control group) | P value | |
|---|---|---|---|---|---|
| Number | 209 | 150 | 265 | 30 | |
| Age (years), mean ± SD | 48.24 ± 10.04 | 58.78 ± 9.4 | 59.94 ± 11.24 | 58.85 ± 5.14 | 0.0301* |
| Range | 28-68 | 40-76 | 38-81 | 48-57 | |
| BMI >25, N (%) | 25 (12%) | 34 (68%) | 190 (72%) | 0 | 0.005* |
| BMI >30, N (%) | 4 (2%) | 6 (13%) | 37(14%) | 0 | 0.009* |
| Sex (female), N (%) | 79 (38%) | 78 (52%) | 148 (56%) | 12 (40%) | 0.005* |
| IHD, N (%) | 146 (70%) | 75 (50%) | 26 (10%) | -- | 0.0002* |
| Hypertension, N (%) | 79 (38%) | 81 (54%) | 153 (58%) | 0 (0%) | 0.029* |
| DM, N (%) | 66 (32%) | 84 (56%) | 159 (60%) | 0 (0%) | 0.024* |
| CKD, N (%) | 12(6%) | 24 (16%) | 74 (28%) | -- | 0.003* |
| Anemia, N (%) | 18 (9%) | 15 (10%) | 42 (16%) | -- | 0.05* |
| CVA, N (%) | 0 | 6 (4%) | 31 (12%) | -- | 0.002* |
| Dyslipidemia, N (%) | 91 (44%) | 60 (40%) | 111 (42%) | 0.09 | |
| Smoking, N (%) | 104 (50%) | 33 (22%) | 26 (10%) | 16 (53%) | 0.021* |
| Thyroid disease, N (%) | 8 (4%) | 12 (8%) | 47 (18%) | 0 (0%) | 0.050* |
| Liver disease, N (%) | 21 (10%) | 9 (6%) | 21 (8%) | 0 (%) | 0.023* |
| Q waves in ECG, N (%) | 146 (70%) | 60 (40%) | 26 (10%) | 0.029* | |
| LVH by ECG, N (%) | 142 (68%) | 90 (60%) | 169 (64%) | -- | 0.09 |
| SBP mmHg, mean ± SD | 100 ± 4.5 | 130 ± 6 | 150 ± 12 | 128 ± 5 | 0.04* |
| DBP mmHg, mean ± SD | 65 ± 3.2 | 70 ± 4 | 100 ± 9 | 75 ± 6 | 0.03* |
| Pulse beat/min, mean ± SD | 95.1 ± 17.29 | 80.9 ± 16.86 | 88.51 ± 17.32 | 68.17 ± 16.37 | 0.014* |
| Creatinine mg%, mean ± SD | 1.71 ± 0.25 | 1.63 ± 0.29 | 1.55 ± 0.27 | 0.95 ± 0.22 | 0.005* |
| Hb gm%, mean ± SD | 10.12 ± 1.6 | 10.94 ± 1.57 | 12.24 ± 1.76 | 13.57 ± 1.57 | 0.038* |
| N-Tpro-BNP, mean ± SD | 540.7 ± 64.69 | 482.3 ± 63.98 | 454.5 ± 43.1 | 24.1 ± 4.38 | 0.001* |
HFrEf: heart failure with reduced ejection fraction; HFmrEF: heart failure with mid-range ejection fraction; HFpEF: heart failure with preserved ejection fraction; BMI: body mass index, DM: diabetes mellitus; PAD: peripheral arterial disease, CVA: cerebrovascular accident, IHD: ischemic heart disease, CKD: chronic kidney disease, LVH: left ventricular hypertrophy, SBP: systolic blood pressure , DBP: diastolic blood pressure, N: number , * : statistically significant.
Table 1: Baseline characteristics of the patients in the 4 groups. Continuous data are presented as mean ± SD or numbers and proportions as appropriate
Echocardiographic criteria
Patients with HFmrEF, had mildly dilated LV internal dimensions with 30% showing concentric hypertrophy and 28% showing eccentric hypertrophy, with significantly more regional wall motion abnormalities (RWMA) compared to group 3 (40 vs. 10%, p=0.022).
Patients with HFrEF, had significantly dilated LV internal dimensions, more (RWMA) with more eccentric hypertrophy remodeling, more RV dysfunction, higher systolic pulmonary pressure, higher left atrial volume index (LAVI), higher filling pressure, and severely impaired strain values when compared to the other 2 heart failure groups.
Patients with HFpEF had significantly smaller LV internal dimensions with more concentric LVH remodeling as compared to the other two heart failure groups (Table 2).
| G1 (HFrEF) | G2 (HFmrEF) | G3 (HFpEF) | G4 (control) | P value | |
|---|---|---|---|---|---|
| IVS (mm), mean ± SD | 9.6 ± 1.18 | 10.2 ± 1.09 | 11.34 ± 2.1 | 9.87 ± 1.0 | 0.009* |
| PW (mm), mean ± SD | 9.73 ± 1.15 | 10.17 ± 1.13 | 11.5 ± 2.23 | 9.91 ± 1.2 | 0.047* |
| LVMI gm/m2, mean ± SD | 141 ± 4 | 138 ± 8 | 136 ± 4 | 99 ± 7 | 0.023* |
| RWMA, N (%) | 183 (88%) | 20 (40) | 26 (10%) | --- | 0.022* |
| RWT, mean ± SD | 0.21 ± 0.06 | 0.39 ± 0.08 | 0.37 ± 0.06 | 0.32 ± 3 | <0.0001* |
| EDVI mL/M2, mean ± SD | 65 ± 4 | 58 ± 10 | 53 ± 4 | 54 ± 3 | 0.022* |
| EDD (mm), mean ± SD | 62.7 ± 3.75 | 56.43 ± 2.12 | 46.3 ± 3.2 | 45.43 ± 2.24 | 0.022* |
| ESD (mm), mean ± SD | 54.3 ± 2.33 | 39.43 ± 2.24 | 28.42 ± 3.1 | 24.8 ± 4.1 | 0.023* |
| EF %, mean ± SD | 29.86 ± 5.37 | 44.5 ± 2.9 | 54.9 ± 3.48 | 67.3 ± 4.58 | <0.0001* |
| Concentric remodeling, N (%) | 0 | 5 (10%) | 53 (20%) | - | |
| Concentric hypertrophy, N (%) | 8 (4%) | 15 (30%) | 116 (44%) | -- | 0.023* |
| Eccentric hypertrophy, N (%) | 100 (48%) | 14 (28%) | 10 (4%) | -- | 0.001* |
| Mitral E DT, mean ± SD | 178.4 ± 8.1 | 184.08 ± 3.71 | 189.76 ± 2.98 | 204.3 ± 3.92 | 0.001* |
| E/A ratio, mean ± SD | 1.1 ± 0.09 | 0.72 ± 0.13 | 0.56 ± 0.07 | 1.03 ± 0.08 | 0.001* |
| LAVI mL/M2, mean ± SD | 43.66 ± 2.08 | 37.7 ± 2.05 | 35.94 ± 2.04 | 21.06 ± 5.16 | 0.001* |
| ESPP mmHg, mean ± SD | 67 ± 4 | 49 ± 8 | 45 ± 9 | -- | 0.001* |
| TAPSE mm, mean ± SD | 12.4 ± 2.6 | 20.8 ± 2.76 | 21.2 ± 2.7 | 21.3 ± 2.56 | 1 |
| DD 1, N (%) | 58 (28%) | 18 (36%) | 74 (28%) | -- | 0.19 |
| DD 2, N (%) | 137 (66%) | 31 (62%) | 185 (70%) | -- | 0.8 |
| DD3, N (%) | 8 (4%) | 1 (2%) | 5 (2%) | -- | 0.9 |
| DD 4, N (%) | 4 (2%) | 0 | 0 | -- | 0.99 |
| E/e’, mean ± SD | 19.44 ± 1.89 | 18.24 ± 1.67 | 15.16 ± 1.01 | 6.96 ± 1.38 | 0.0001* |
| DWS, mean ± SD | 0.21 ± 0.02 | 0.24 ± 0.06 | 0.32 ± 0.03 | 0.4 ± 0.02 | <0.0001* |
| MPI %, mean ± SD | 0.60 ± 0.03 | 0.52 ± 0.09 | 0.49 ± 0.16 | 0.35 ± 0.2 | <0.001* |
| GRS %, mean ± SD | 8 ± 0.5 | 11 ± 1.7 | 26 ± 2 | 42 ± 2 | <0.001* |
| GCS %, mean ± SD | 6 ± 0.06 | 9 ± 0.08 | 11 ± 1.2 | 20 ± 1.7 | 0.002 * |
| GLS %, mean ± SD | 6.4 ± 1.14 | 9.5 ± 1.71 | 11.52 ± 1.31 | 18.68 ± 1.26 | 0.048* |
Table 2: Echocardiographic criteria of the 4 groups. Continuous data are presented as means ± SD or numbers and proportions as appropriate.
Diastolic wall strain (DWS)
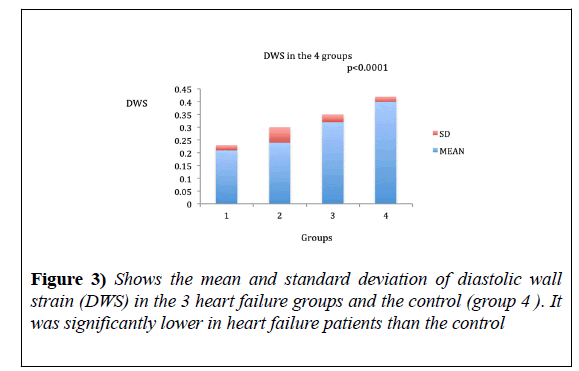
DWS ranged from 0.17-0.25% in HFrEF with the mean of 0.21 ± 0.02, 0.12-0.36% with the mean of 0.24 ± 0.026 in HFmrEF and 0.26-0.38 in HFpEF with the mean of 0.32 ± 0.03 (Figure 3).
DWS was significantly lower in all heart failure groups as compared to the control (ANOVA, p<0.0001). Also, DWS was significantly lower in HFrEF as compared to the other groups (Table 2).
Correlations
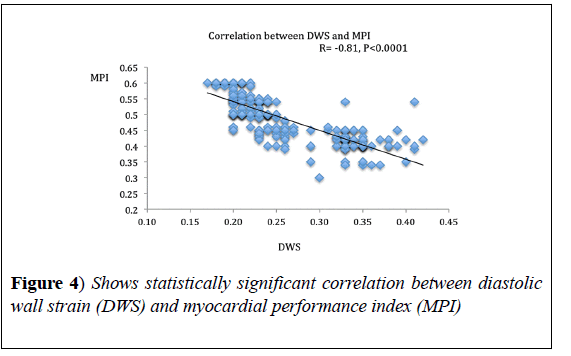
DWS showed significant correlation with MPI (r=-0.81, p<0.0001) and GRS (r=0.72, p<0.0001). DWS also, showed a strong negative correlation with E/e’ ratio (r=-0.66, p<0.001) (Figures 4-6), (Table 3).
| R COEFFECIENT | P VALUE | |
|---|---|---|
| Ejection fraction | 0.366 | 0.051 |
| Mitral E, deceleration time | 0.129 | 0.148 |
| IVRT | 0.413 | <0.01* |
| e’ | 0.59 | 0.03* |
| E/A ratio of mitral inflow | -0.173 | 0.014* |
| E/e’ ratio | -0.662 | <0.001* |
| Global circumferential strain | 0.602 | <0.0001* |
| Global radial strain | 0.72 | <0.0001* |
| Global longitudinal strain | 0.592 | <0.001* |
| Left atrial volume index | -0.655 | <0.001* |
| Left ventricular mass index | -0.12 | 0.09 |
| End diastolic volume index | -0.19 | 0.12 |
| Relative wall thickness | -0.23 | =0.05* |
| MPI | -0.81 | <0.0001* |
| NT pro-BNP | -0.693 | =0.001* |
| Tricuspid annular plane systolic excursion (TAPSE) | 0.023 | 0.752 |
IVRT: iso-volumetric relaxation time; e’: Tissue Doppler e’ wave at lateral mitral annulus; MPI: myocardial performance index; * : statistically significant.
Table 3: Pearson correlations between different parameters and diastolic wall strain.
Reproducibility
There was excellent reproducibility between the values measured by the same examiner and the 2 examiners; the CV was 4% and 5% for intraobserver and inter-observer variability respectively.
Discussion
To the best of our knowledge, this is the first study that addressed DWS as an indicator of diastolic stiffness in HFmrEF and compares it to the other two groups of heart failure patients. It also showed that DWS correlated with MPI for the first time.
The study proved that measurement of DWS is feasible and reproducible in HF patients. DWS correlated well with the non-invasive parameters of high filling pressure such as E/e′, LAVI, pro-BNP level, and with GRS, GCS and GLS as indices of systolic function, the best correlation was with MPI (an index of both systolic and diastolic functions) [13], so this study proved that DWS is an indicator of myocardial performance, both systolic and diastolic.
Takeda et al. [1], were the first investigators to find relation between DWS and diastolic stiffness constant obtained invasively and explained this relation on the concept of the linear elastic theory, whereby distending forces exerted on the stiff myocardium in diastole produce less diastolic deformation (wall thinning) and greater translational (epicardial) wall movement. But they did not find a correlation with tissue Doppler derived strain contrasting with our findings, as we found strong correlation between DWS and the three parameters of strain (derived from speckle tracking). This may reveal the greater challenges of measuring strain with tissue Doppler imaging; as it is angle dependent, so measurement of circumferential and radial strain could be very difficult.
Selvaraj et al. [2], correlated DWS with various systolic and diastolic parameters, and found strong correlation with global systolic strain parameters and e’ wave agreeing with our findings, that DWS is an indicator of both systolic and diastolic indices but found no correlation with E/e’ in contrast to our results, this could be due to the fact that they studied only hypertensive patients with only 17% of them having LVH, and they did not measure the e’ from tissue Doppler mode but, they converted speckle tracking echocardiography-derived tissue velocities into tissue Doppler velocities using a regression equation.
In the present study, we found strong correlation between GRS and DWS; this is expected based on the mathematical formulations of both DWS and radial strain, however Aguilar FA et al. [14], found only modest correlation between DWS and GRS, maybe because of some technical issues as they used a different software for strain analysis.
Our study showed that DWS was significantly lower in all 3 groups of heart failure patients as compared to the normal subjects suggesting reduced myocardial performance. However, patients with HFrEF showed the lowest DWS as they had more eccentric hypertrophy remodeling and higher filling pressures.
Ohtani et al. [5], studied patients with HFpEF, and compared them to normal control group. The mean DWS was 0.33 ± 0.05 vs 0.40 ± 0.07, agreeing with our results 0.32 ± 0.03 vs 0.4 ± 0.02.
The findings of Minamisawa et al. [3], showed modest correlation of DWS with pro-BNP levels which conflicts with our results as we found a strong correlation. A possible reason for this is that they studied patients at risk of heart failure where, we studied patients with clinical heart failure.
DWS is an index of global myocardial performance, so its use for diagnosis of isolated systolic or diastolic dysfunction maybe confusing, but its use for detection of early subclinical myocardial dysfunction in patients at risk for heart failure [3], in adult patients who received chemotherapy during childhood [15], and in chronic stable angina patients who need revascularization [16] were tested.
Limitation of the Study and Future Direction: Though there are many strengths of our study, results should be interpreted with respect to some limitations as the small sample size, and lower number of HFmrEF patients as compared to the other 2 groups of heart failure so the results may need to be confirmed with a larger number of patients.
DWS could be used to detect patients with valvular heart disease who need early intervention and to follow up myocardial recovery after medications or intervention.
Conclusion
Measurement of DWS is feasible and reproducible in heart failure patients. DWS was significantly lower in HF patients as compared to normal subjects, and it appears to reflect overall myocardial performance as it correlated well with both systolic and diastolic echocardiographic parameters. Given its ease of use and widespread applicability, calculation of DWS should be recommended in routine echocardiographic examination.
REFERENCES
- Takeda Y, Sakata Y, Higashimori M, et al. Noninvasive assessment of wall distensibility with the evaluation of diastolic epicardial movement. J Card Fail. 2009;15(1):68-77.
- Selvaraj S, Aguilar FG, Martinez EE, et al. Diastolic wall strain: a simple marker of abnormal cardiac mechanics. Cardiovasc Ultrasound. 2014;12(1):40.
- Minamisawa M, Miura T, Motoki H, et al. Prognostic Impact of Diastolic Wall Strain in Patients at Risk for Heart Failure. Int heart J. 2017;58(2):250-6.
- Soyama Y, Mano T, Goda A, et al. Prognostic value of diastolic wall strain in patients with chronic heart failure with reduced ejection fraction. Heart Vessels. 2016;32(1):68-75.
- Ohtani T, Mohammed SF, Yamamoto K, et al. Diastolic stiffness as assessed by diastolic wall strain is associated with adverse remodelling and poor outcomes in heart failure with preserved ejection fraction. Eur Heart J. 2012;33(14):1742-9.
- Ponikowski P, Voors A, Anker SD, et al. 2016 ESC Guidelines for the diagnosis and treatment of acute and chronic heart failure: The Task Force for the diagnosis and treatment of acute and chronic heart failure of the European Society of Cardiology (ESC). Eur Heart J. 2016;37(27):2129-200.
- McKee PA, Castelli WP, McNamara PM, et al. The natural history of congestive heart failure: the Framingham study. N Engl J Med. 1971;285:1441-6.
- The Criteria Committee of the New York Heart Association. Nomenclature and Criteria for Diagnosis of Diseases of the Heart and Great Vessels. 9th ed. Boston: Little, Brown & Co.; 1994;253-6.
- Sokolow M, Lyon TP. The ventricular complex in left ventricular hypertrophy as obtained by unipolar precordial and limb leads. Am Heart J. 1949;37(2):161-86.
- Lang RM, Badano LP, Avi VM, et al. Recommendations for cardiac chamber quantification by echocardiography in adults: an update from the American society of echocardiography and the European association of cardiovascular imaging. J Am Soc Echocardiogr. 2015; 28(1):1-39.
- Stanton T, Leano R, Marwick TH. Prediction of All-Cause Mortality From Global Longitudinal Speckle Strain. Circ Cardiovasc Imaging. 2009;2(5):356-64.
- Nagueh SF, Appleton CP, Gillebert TC, et al. Recommendations for the evaluation of left ventricular diastolic function by echocardiography. J Am Soc Echocardiogr. 2009;22(2):107-33.
- Lakumentasi JA, Panou FK, Kotseroglu VK, et al. The Tei Index of Myocardial Performance: Applications in Cardiology. Hellenic J Cardiol. 2005;46:52-8.
- Aguilar FA, Selvaraj S, Martinez EE, et al .Archeological echocardiography: digitization and speckle-tracking analysis of archival echocardiograms in the HyperGEN study. Echocardiography. 2016;33(3):386-97.
- Li VW, Cheuk DK, Cheng FW, et al. Myocardial stiffness as assessed by diastolic wall strain in adult survivors of childhood leukaemias with preserved left ventricular ejection fraction. Eur Heart J Cardiovasc Imaging. 2017;18(4):451-58.
- Choi J, Kang MK, Han C, et al. Lower diastolic wall strain is associated with coronary revascularization in patients with stable angina. BMC Cardiovasc Disord. 2017;17(1):301.


