Cluster analysis identifies two cognitive profiles among offspring of patients with a major psychiatric disorder: The healthy and impaired profiles
2 CERVO Brain Research Centre, 2601, de la Canardière, Québec, Canada G1J 2G3, Canada, Email: valerie.jomphe.chum@ssss.gouv.qc.ca
3 Department of Psychiatry and Neuroscience, Faculty of Medicine, Laval University, 2325 Rue de l’Université, Québec, QC G1V 0A6, Canada, Email: michel.maziade@fmed.ulaval.ca
Received: 30-Jun-2018 Accepted Date: Jul 26, 2018; Published: 01-Aug-2018
Citation: Peredo R, Jomphe V, Maziade M, et al. Cluster analysis identifies two cognitive profiles among offspring of patients with a major psychiatric disorder: The healthy and impaired profiles. J Child Adolesc Psych 2018;2(2):6-11.
This open-access article is distributed under the terms of the Creative Commons Attribution Non-Commercial License (CC BY-NC) (http://creativecommons.org/licenses/by-nc/4.0/), which permits reuse, distribution and reproduction of the article, provided that the original work is properly cited and the reuse is restricted to noncommercial purposes. For commercial reuse, contact reprints@pulsus.com
Abstract
Background: Studies have shown that patients with Schizophrenia (SZ) or Bipolar Disorder (BP) have cognitive deficits. Several studies have also reported that offspring of SZ or BP parents performed worse, on average, than non at risk offspring. However, only a minority of at risk offspring will develop SZ or BP later on. Hence, the reported deficits concerning them may represent a mixture of larger and smaller deficits which, respectively, would refer to those subjects who would eventually convert versus those who never would. The present study addresses this issue by attempting to separate the at-risk offspring into two subgroups according to their cognitive performance.
Methods: Our sample was composed of 131 at risk offspring from 6 to 24 years old assessed on five cognitive domains: Processing speed, Verbal memory, Visual Memory (VISEM), Working memory, and Executive functioning. A hierarchical clustering analysis was performed on all five domains. The pseudo F statistics and Pseudo T square-index were used to estimate the number of clusters. Then each cluster found was compared to a matched sample of 131 healthy control subjects using a two way ANOVA.
Results: Two clusters were revealed: a cluster of at risk offspring that showed a cognitive profile almost identical to that of control subjects, and another cluster that performed much worse than the healthy controls with effect sizes often exceeding those previously seen in the literature, and reaching 2.3 for VISEM.
Conclusion: To our knowledge, this is the first study highlighting a very healthy cognitive performance for a subset of at risk offspring, but a worse than known performance in the remaining offspring. Still, further longitudinal studies are needed to investigate whether these findings are associated with the transition to a major psychiatric disorder such as SZ or BP.
Keywords
Schizophrenia; Mood disorders; Bipolar disorder; Child psychiatry; Cognitive neuroscience
Introduction
Literature has shown significant associations between different psychiatric disorders and neurocognitive impairment [1,2]. More precisely, it has been well established that subjects with schizophrenia (SZ) and bipolar disorder (BP) display measurable dysfunctions in several cognitive domains [3-7]. Also, our previous publications [8-10], in agreement with other authors [11,12], showed that offspring of parents with SZ or BP performed worse in various cognitive domains than those without a family risk. Indeed, we reported that children at genetic High Risk (HR) differed from controls with effect sizes ranging from 0.34 to 1.37 [10], suggesting that HR offspring engage early in childhood along a deficient cognitive trajectory. Moreover, according to Hou et al. the magnitude of these cognitive impairments decreases gradually from patients with psychosis, to ultra-high risk (UHR) individuals, to non-affected first degree relatives of patients [13]. Although the effect sizes reported varied according to the domain and definition of subjects at risk, these deficits were always obtained from data involving the entire sample of subjects at risk, even though it is known that less than a third of them will eventually develop a severe mental illness, whereas, fortunately, two thirds will not convert to SZ or BP [14,15]. Hence, the effect sizes previously reported may represent a mixture of larger and smaller deficits, which, respectively, would refer to those subjects who would eventually convert versus those who never would.
The present study addresses this issue by attempting to separate offspring born to parents with SZ or BP into two subgroups according to their cognitive profiles. Our hypothesis was that two distinct subtypes of HR youths would emerge: one with cognitive functioning resembling those of control subjects and another with more impaired cognitive functions.
Methods
Sample
This cross-sectional study used a cohort design recruitment strategy: the cohort, referred to as the High Risk (HR) cohort, was defined as subjects having a parent affected by either SZ or BP. Each participant was matched for gender and age ( ± one year) with an individual in a control group, referred to as the control cohort. Our main approach, based on cluster analysis, was carried out using only the HR cohort. The control group was used as a reference in order to facilitate the interpretation of cognitive profiles within each resulting cluster of subjects.
We recruited 131 HR subjects from 6 to 24 years old. The data was drawn from previous independent studies that targeted all the multigenerational families densely affected by SZ or BP in the Eastern Québec (Canada) and sporadic families in the catchment area [9]. The inclusion criterion for the HR cohort was having a parent with a definite diagnosis of SZ or BP disorder according to the DSM-IV. The exclusion criteria were the presence of a diagnosis of DSM-IV psychotic disorder, BP or major depression, brain and metabolic disorders known to cause neuropsychological impairments. The individuals in the control group were selected from our data bank of control subjects assessed over the years of previous projects [3,8-10]. They were recruited through ads in local newspapers. The exclusion criteria for this group were the same as those in HR with the addition of any axis I DSM diagnosis or a first-degree positive family history of SZ or BP spectrum disorders. We restricted both HR and control subjects to youths of 24 years old or less to remain below the age of onset of SZ and BP. Written informed consent was obtained for all participants.
Measurement variables for cluster analysis
Cognitive battery: In order to perform the cluster analysis, we chose the cognitive domains as previously reported by Paccalet et al. [16], based on two main criteria: impairments in domains consistently reported in patients with the largest effect sizes (ES of 0.8 to 1.2) [17,18]; and impairments in domains also reported in children at genetic risk of schizophrenia [8,19,20]. Five domains met these conditions: verbal and visual episodic memory, processing speed, working memory and executive functions. Briefly, the 5 cognitive domains were composed as in Gilbert et al. [3], by grouping two tests as follows : 1) The Processing Speed domain grouped the digit symbol substitution Task from the WAIS –III and the Category Fluency (animal naming); 2) The Verbal Episodic Memory (VEM) domain grouped the California Verbal Learning Test (CVLT II) total recall trials 1-5 and the delayed recall: 3) The Visual Episodic Memory (VISEM) domain grouped the Rey Complex Figure (RFC) immediate and the delayed recall; 4) The Working Memory domain grouped the Digit span from the WAIS-III and the Spatial Span, and 5) The Executive Functioning domain grouped the Wisconsin Card Sorting Test (total errors) and the Tower of London (TOLDX: number of problems solved in minimum moves). To assess a cognitive domain, z scores for each of the two subtests were calculated using data from published standardized norms and then the mean of the two subtest z scores were calculated and converted into percentiles. We chose not to include IQ in the present analysis given that this cognitive test is known to be highly correlated with the other domains.
Statistical analysis: Data were analyzed using SAS software version 9.4. First, all individuals from the HR cohort and control group were divided into four age classes: 6 to 10, 11 to 15, 16 to 20 and 21 to 24 years old. Then a hierarchical agglomerative clustering analysis was performed on the five cognitive domains among the HR cohort by age group. The Ward’s method, based on Euclidean distance, was used with the “by age class” statement and the “method=war” option in the CLUSTER procedure. This method was preferred in order to minimize the within-group dispersion and to minimize the overlap [21]. The Average method was also conducted in order to verify if similar results would be obtained with one other clustering method.
In order to estimate the number of clusters, Pseudo F statistics and Pseudo T-squared were analyzed. The peak of Pseudo F indicates the cluster solution with the best separated clusters and closest knit of subjects within cluster. Pseudo T-square index quantifies the dissemblance between two clusters that are merged at a given step. Thus if the pseudo T-square has a distinct jump at step k of the hierarchical clustering then the clustering in step k+1 is selected as the optimal cluster [22,23].
Once the clusters were obtained from the HR cohort, then they were compared to the control group through a two-way ANOVA, taking into account the age classes as the second factor. Assumptions of normality were tested for all variables according to the Shapiro-Wilk test [24] and the Kurtosis and Skewness statistics [25,26]. Homogeneity of variance was tested by evaluating the residual plots of each variable. For ANOVAs that yielded a significant F statistics at p ≤0.05 of the overall model, we verified whether the Group*Age interaction was significant, and, if so, groups were compared separately within each age class. Otherwise, group comparisons were made over all ages. Finally, the Cohen’s d effect size (ES) was calculated between each cluster and the control group.
Some siblings were in the same age class. Despite this could have created some dependency, we decided to analyze the full sample and used these sibships as a particularly interesting subsample within which we could observe whether or not the sibs would fall into the same cluster.
Results
Table 1 show the age and gender distribution within the High Risk (HR) cohort and the control group. Age and sex did not differ between the HR and control groups due to our matching design. However, as expected and shown elsewhere the mean socioeconomic status index was significantly lower (t value of 3.69; p<0.05) in families of HR subjects (41.3, SD 15.6) than in the control group (48.9, SD 17.0), according to the Family Blishen index [27].
| HR | Control * | |
|---|---|---|
| (N=131) | (N=131) | |
| Age | n (%) | n (%) |
| 6 to 10 | 17 (13.0) | 17 (13.0) |
| 11 to 15 | 39 (29.8) | 39 (29.8) |
| 16 to 20 | 38 (29.0) | 38 (29.0) |
| 21 to 24 | 37 (28.2) | 37 (28.2) |
| Gender (female) | 65 (49.6) | 65 (49.6) |
| Socioeconomic statusa | 41.3 (15.6) | 48.9 (16.9) |
*Due to our method design, the control group shows the exact same age and gender distribution as the HR group. a:HR group differed from control group on the socioeconomical status according to the Family Blishen index ( t=-3.57 p=0.0005).
Table 1: Age and gender distribution within the High Risk (HR) group and the control group
Cluster analysis
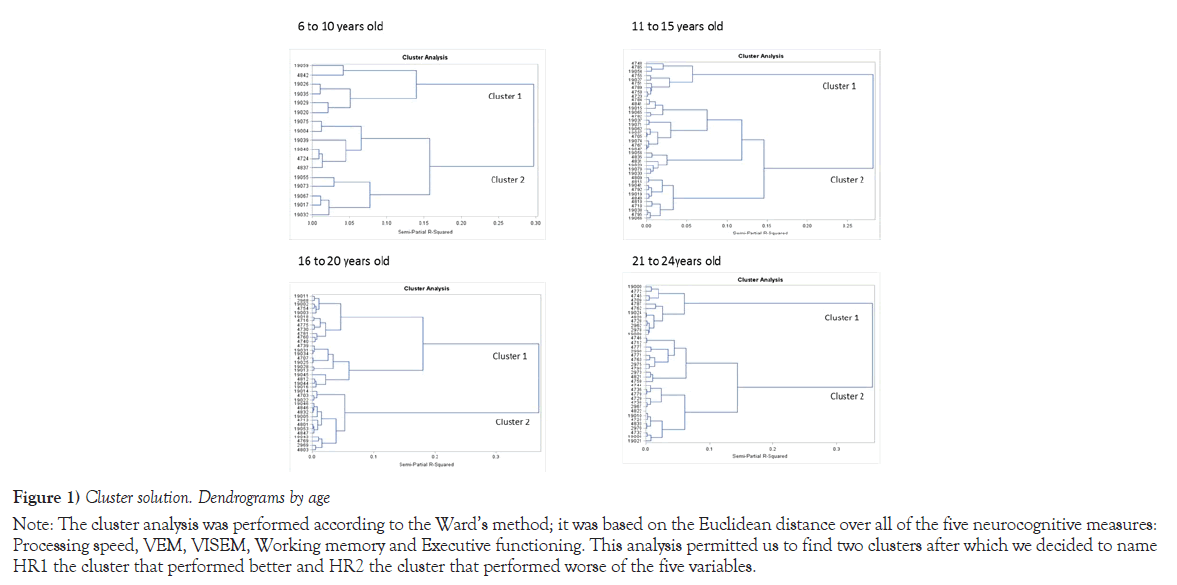
The dendograms in Figure 1 illustrate the cluster solutions obtained with the Wards method for each age class, whereas Table 2 provides the corresponding Pseudo F and T-square statistics for the last five cluster solutions. According to the criteria that we described earlier, both tests revealed a two cluster solution as we hypothesized upfront. In order to evaluate the sensitivity of the algorithm used, we repeated the analysis using a different clustering procedure, the Average Hierarchical method, which also yielded two clusters showing 86% of concordance with those from the Ward’s method. These findings support the internal consistency of the Ward’s analysis. Within each age class, the cluster that showed the best cognitive functioning was termed HR1, whereas the cluster performing the worst was named HR2. Hence, HR2 was composed of 76 HR subjects, whereas the HR2 comprised 55 HR subject. Among, the 55 subjects who fell into the impaired HR2 group, 11 had a sibling in the same age class 4 of whom fell into the opposite cluster.
| Age class in years | ||||||||
|---|---|---|---|---|---|---|---|---|
| 6 to 10 | 11 to 15 | 16 to 20 | 21 to 24 | |||||
| Cluster solution | Pesudo F statistics | Pseudo t-squared | Pesudo F statistics | Pseudo t-squared | Pesudo F statistics | Pseudo t-squared | Pesudo F statistics | Pseudo t-squared |
| 5 | 6.1 | 3.3 | 13.9 | 5.5 | 16.3 | 6.1 | 13.3 | 6.2 |
| 4 | 6.3 | 3.7 | 14 | 8.8 | 17.8 | 5.8 | 14.2 | 8.3 |
| 3 | 5.8 | 4.5 | 13.4 | 8.8 | 21.4 | 5.4 | 17 | 4.4 |
| 2 | 6.4 | 5 | 14.5 | 9.2 | 21.1 | 13.6 | 19.4 | 9.7 |
| 1 | - | 6.4 | - | 14.5 | - | 21.1 | - | 19.4 |
a: Given that we hypothetized a priori a 2-cluster solution we are only showing the last five cluster solution, as a way of distinguishing the 2-cluster solution from the 1-cluster solution or from a slightly higher number of clusters.
Note: The Pseudo F statististics showed a peak value at the 2-cluster solution for most age classes, while the Pesudo T-squared showed a strong jump at the 1-cluster solution suggesting that the two previous clusters should not be lumped together. Thus also favoring a 2-cluster solution.
Table 2: Estimation of the number of clusters by age class, based on Pseudo F statistics and Pseudo t-squared for the last 5 cluster solutions
Note: The cluster analysis was performed according to the Ward’s method; it was based on the Euclidean distance over all of the five neurocognitive measures: Processing speed, VEM, VISEM, Working memory and Executive functioning. This analysis permitted us to find two clusters after which we decided to name HR1 the cluster that performed better and HR2 the cluster that performed worse of the five variables.
Figure 1) Cluster solution. Dendrograms by age
Neurocognitive characteristics of the clusters
The mean of each cognitive domain for each cluster (HR1 and HR2) and for the control group are shown in Table 3. Assumptions of normality and homoscedasticity were met according to the criteria previously mentioned. The table, also shows that the overall F test was significant (p<.0001) for all five cognitive domains, whereas the interaction Group*Age was significant for Processing Speed (p=0.03), Verbal Episodic Memory (VEM) (p=0.007) and Visual Episodic Memory (VISEM) (p=0.0005).
| Control N= 131 | HR1 | HR2 | Control vs HR 1 vs HR 2 | ||||
|---|---|---|---|---|---|---|---|
| N = 76 | N= 55 | ||||||
| Neurocognitive domains | Mean (SD) | Mean (SD) | Mean (SD) | Overall model a | Interaction Group*Age | ||
| F (df1,df2) | p value | F (df1,df2) | p value | ||||
| Processing speed | 54.2 | 55.57 | 30.5 | 8.59 (11,249) | <.0001 | 2.40 (6,249) | 0.0287 |
| (23.8) | (18.9) | (21.0) | |||||
| VEM | 74.6 | 69.6 | 39.6 | 13.50 (11,249) | <.0001 | 3.02 (6,249) | 0.0072 |
| (18.9) | (19.9) | (26.5) | |||||
| VISEM | 46.3 | 41.8 | 16.6 | 7.91 (11,249) | <.0001 | 4.14 (6,249) | 0.0005 |
| (30.6) | (29.0) | (17.1) | |||||
| Working memory | 57.2 | 53.7 | 33.1 | 7.99 (11,249) | <.0001 | 1.74 (6,249) | 0.1116 |
| (22.0) | (19.4) | (18.3) | |||||
| Executive functioning | 62.7 | 58.7 | 51.5 | 5.36 (11,249) | <.0001 | 0.70 (6,249) | 0.651 |
| (21.7) | (24.9) | (23.6) | |||||
a:Overall model includes the group factor involving HR1, HR2 and control cohort, the age factor, involving the four age classes and the interaction between the two factors, i.e. group*age.
Table 3: Means of percentile ratings within each cluster (HR1 and HR2) and the control group for each cognitive domain, with the F statistics of the two-way ANOVA for the overall model and the Age*Group interaction
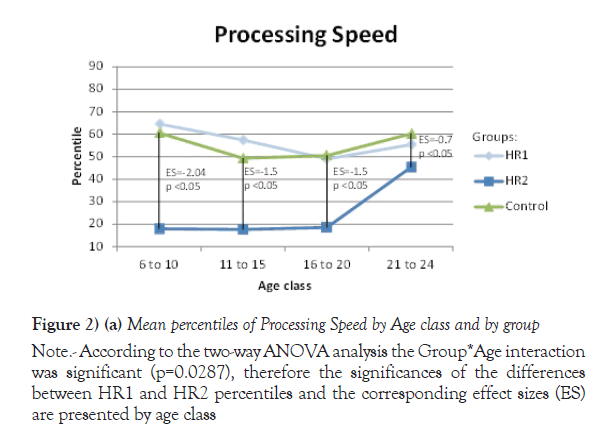
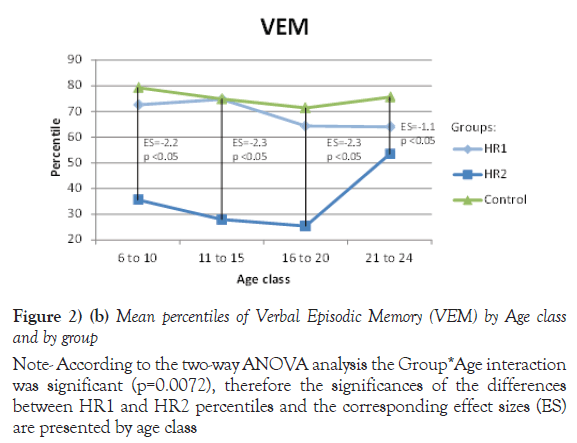
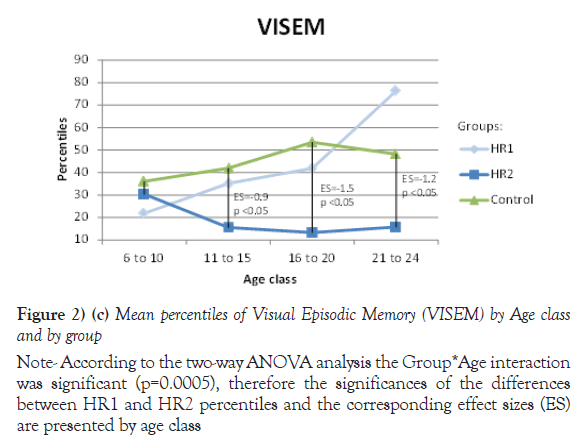
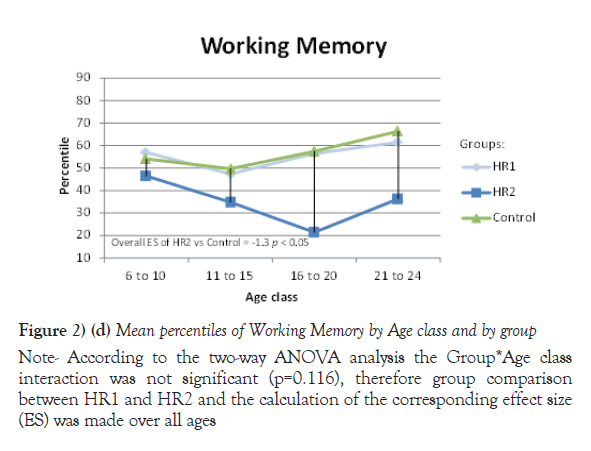
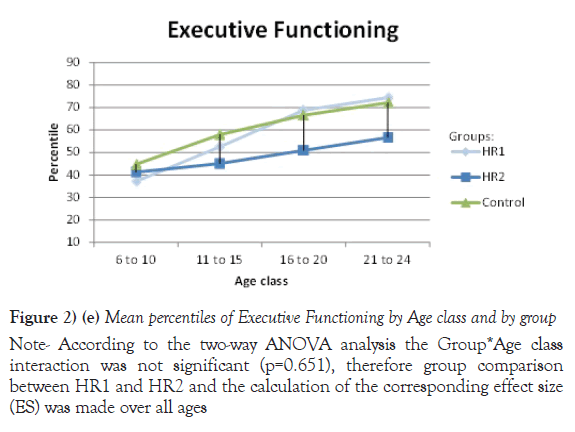
Due to their significant Group *Age interaction, the mean of percentiles for Processing speed, VEM and VISEM are presented by age class, whereas the mean of percentiles for the other two domains, Working Memory and Executive Functioning, are presented over all ages. The differences between the HR1 and HR2 groups were statistically significant (p ≤ 0.05) on Processing Speed and VEM for each of the first three age classes (from 6 to 20 years old), while the two groups differed on VISEM for the last three age classes (from 11 to 24 years old). As for Working Memory and Executive Functioning, subjects in HR2 performed significantly worse than subjects in HR1 (p ≤ 0.05 and p=0.002 respectively). On the other hand, the HR1 group was almost never different from the control group (p ≥ 0.05) in all functions and almost all age classes, whereas the HR2 group was found to differ significantly from the control group for all cognitive domains and most age classes. Figures 2a-2e plot the mean of percentiles obtained for each group by age class in each domain. Strikingly, the HR1 cognitive profile was very similar to that of the control group in each domain. Figures 2a-2c also show the effect sizes representing the differences between the HR2 and the control group in age classes where the differences were found significant in Table 4. One overall effect size was calculated between the HR2 and the control group for Working Memory and Executive Function (Figures 2d and 2e) given that there was no significant Group*Age interaction for these domains (Table 3). The corresponding overall effect size was 1.3 (p<0.5) and 0.6 (p<0.5) for Working Memory and Executive Function respectively. As illustrated, the HR2 group differed from the control group with an effect size ranging from 0.7 for the Processing Speed in age class 21 to 24 years old, to 2.3 for Visual Memory for subjects aged between 11 to 20 years old.
| Group | Group Comparisonsb | ||||||||
|---|---|---|---|---|---|---|---|---|---|
| Neurocognitive Domain | HR1 | HR2 | Control | HR1 vs HR2 | HR1 vs control | HR2 vs control | |||
| Age class in years | N | Meana (SD) | N | Meana (SD) | N | Meana (SD) | p value | p value | p value |
| Processing speed | |||||||||
| 6 to 10 | 11 | 64.6 (23.9) | 6 | 17.9 (13.4) | 17 | 60.6 (22.3) | <.05 | 0.62 | <.05 |
| 11 to 15 | 30 | 57.4 (18.2) | 9 | 17.7 (12.8) | 39 | 49.3 (25.6) | <.05 | 0.11 | <.05 |
| 16 to 20 | 23 | 48.9 (17.0) | 15 | 18.5 (12.9) | 37 | 50.5 (24.1) | <.05 | 0.78 | <.05 |
| 21 to 24 | 12 | 55.4 (16.7) | 25 | 45.3 (19.7) | 37 | 60.2 (20.9) | 0.17 | 0.49 | <.05 |
| Verbal Episodic Memory (VEM) | |||||||||
| 6 to 10 | 11 | 72.6 (14.6) | 6 | 35.6 (17.2) | 17 | 79.3 (13.8) | <.05 | 0.39 | <.05 |
| 11 to 15 | 30 | 74.7 (18.6) | 9 | 27.9 (20.5) | 39 | 74.9 (15.1) | <.05 | 0.97 | <.05 |
| 16 to 20 | 23 | 64.3 (19.3) | 15 | 25.4 (19.5) | 37 | 71.4 (22.7) | <.05 | 0.18 | <.05 |
| 21 to 24 | 12 | 64.0 (26.4) | 25 | 53.4 (27.9) | 37 | 75.6 (20.3) | 0.14 | 0.09 | <.05 |
| Visual Episodic Memory (VISEM) | |||||||||
| 6 to 10 | 11 | 21.9 (19.6) | 6 | 30.3 (21.8) | 17 | 36.1 (24.6) | 0.53 | 0.17 | 0.65 |
| 11 to 15 | 30 | 35.1 (24.4) | 9 | 15.5 (20.4) | 39 | 41.9 (28.5) | 0.05 | 0.29 | <.05 |
| 16 to 20 | 23 | 41.9 (30.4) | 15 | 13.3 (14.0) | 37 | 53.5 (31.7) | <.05 | 0.1 | <.05 |
| 21 to 24 | 12 | 76.4 (12.2) | 25 | 15.7 (15.9) | 37 | 48.2 (33.2) | <.05 | <.05 | <.05 |
| Working memory | 76 | 53.7 (19.4) | 55 | 33.1 (18.3) | 131 | 57.2 (22.0) | <.05 | 0.5 | <.05 |
| Executive functioning | 76 | 58.7 (24.9) | 55 | 51.5 (23.6) | 131 | 62.7 (21.7) | 0.002 | 0.51 | <.05 |
a: Means are presented by age class for the domains for which the Age*Group interaction was found significant in Table 3. b: p value obtained from a two sample, two sided t-test.
Table 4: Means of percentile ratings within each group for each neurocognitive domain with group comparisons
Note: According to the two-way ANOVA analysis the Group*Age interaction was significant (p=0.0287), therefore the significances of the differences between HR1 and HR2 percentiles and the corresponding effect sizes (ES) are presented by age class
Figure 2) (a) Mean percentiles of Processing Speed by Age class and by group
Note: According to the two-way ANOVA analysis the Group*Age interaction was significant (p=0.0072), therefore the significances of the differences between HR1 and HR2 percentiles and the corresponding effect sizes (ES) are presented by age class
Figure 2) (b) Mean percentiles of Verbal Episodic Memory (VEM) by Age class and by group
Note: According to the two-way ANOVA analysis the Group*Age interaction was significant (p=0.0005), therefore the significances of the differences between HR1 and HR2 percentiles and the corresponding effect sizes (ES) are presented by age class
Figure 2) (c) Mean percentiles of Visual Episodic Memory (VISEM) by Age class and by group
Note: According to the two-way ANOVA analysis the Group*Age class interaction was not significant (p=0.116), therefore group comparison between HR1 and HR2 and the calculation of the corresponding effect size (ES) was made over all ages
Figure 2) (d) Mean percentiles of Working Memory by Age class and by group
Note: According to the two-way ANOVA analysis the Group*Age class interaction was not significant (p=0.651), therefore group comparison between HR1 and HR2 and the calculation of the corresponding effect size (ES) was made over all ages
Figure 2) (e) Mean percentiles of Executive Functioning by Age class and by group
Discussion
One of the most striking results from our study was to detect a subgroup of HR offspring that showed a cognitive performance almost identical to that of control subjects of the same age. Indeed, our study was done in two phases. First we performed a cluster analysis only among HR offspring, ignoring the control group. Once the two subgroups HR1 and HR2 were identified, a second phase was performed in order to compare each subgroup to the control group, which revealed that HR1 subjects had a very similar and almost identical cognitive performance to control subjects. These two independent phases guaranteed that the resemblance between HR1 and the control cohort was not a statistical artefact.
Our statistical approach differed from previous studies that also attempted to split high risk subjects into a more or less vulnerable group. One of these studies [28] used a likelihood function to classify each clinical high risk subject according to whether the subject had either a greater resemblance with a group of healthy control (HC) subjects or rather with SZ patients. Their results also reported two groups referred to as CHR-HC and CHR-SZ which showed average cognitive performances that were slightly worse and slightly better than those of healthy and SZ subjects respectively, allowing us to observe a gradual decline in cognition from healthy to SZ patients passing through CHR-HC and CHR-SZ. The advantage of our approach based on cluster analysis was that our two subgroups of HR subjects could be identified without the need of SZ patients and even without a healthy subjects group. In our study these latter subjects became useful only as a comparison after the splitting up of the HR offspring cohort. Another attempt to divide HR individuals conducted by Hou et al. [13], was approached by separating them into two groups according to clinical criteria: one of UHR and another group of first degree relatives that did not fulfill the UHR criteria. Their results for both subgroups differed significantly from the healthy control group on most cognitive domains, with effect sizes that varied from 0.26 to 0.8. Hence, their way of subgrouping subjects did not allow them to pinpoint the cluster of HR that was very similar to control subjects.
In the present study, the cognitive performance of the HR2 subgroup was compared to that of controls, the effect size ranged from 0.2 to 2.3 according to the age class and cognitive domain. Hence, although some of our HR offspring were very proximate to healthy subjects, the other HR2 subgroup performed even worse than the Clinical High Risk (CHR) individuals as reported in a meta-analysis [29] of 32 studies; that showed effect sizes ranging from 0.2 to 0.86. However, one must bear in mind that the CHR group comprised subjects who will eventually convert to psychosis and also those who won’t, which could explain why their effect sizes were smaller than ours. Moreover, it is important to note that the studies mentioned above did not necessarily use the same neurocognitive tests that we did.
Besides the statistical approach, one of our strengths was the power provided by our sample size of 131 HR individuals and 131 healthy subjects. This sample size allowed us to perform the cluster analysis taking into account the age classes in the HR cohort. Moreover, we purposely kept the 11 subjects who had a sibling in the same age class in order to be able to observe whether they would fall into the same cluster or not. It turned out that 4 of them fell into the opposite cluster. This approach allowed us to show that two individuals in the same sibship and same age class could have a different cognitive susceptibility.
Our study does have some limitations. First, this was a cross-sectional study, meaning that each individual belonged to a specific age class. Therefore we cannot determine if the HR2 individuals of a specific class will remain susceptible or not over time. Follow up studies are needed to address this issue. Another limitation is that although our sample size allowed us to cluster subjects by age class, it was not large enough to perform the analysis within strata defined according to the familial/genetic loading or according to their parents’ diagnoses. Nevertheless, we observed that the proportion of HR having more than one first degree affected parent was very similar between the HR1 (48%) and the HR2 (52%) subgroups (X2=0.81, p=0.37), suggesting that the loading of the disorder does not explain our results of finding two distinctly neurocognitive profiles.
Also, we compared the proportion of HR having a parent with SZ, BP or both between HR1 and HR2, and found no significant differences (X2=4.58, p=0.10) with rates of 15.8%, 80.3%, 3.9% respectively in the HR1 group vs rates of 27.3%, 67.3%, 5.5% for the HR2 respectively.
Since the risk of a psychiatric disorder is strongly associated with socioeconomic status [30,31] and since the link between brain structure and cognitive processes vary by family socioeconomic circumstances [32], we decided to verify if this variable could explain our findings by comparing the mean scores of the Family Blishen index between clusters and control groups. We found that the means did not differ between the two clusters (t=0.89 p=0.37), whereas both HR1 and HR2 differed from the control group (t=2.47 p=0.01 and t=-3.19 p=0.0016 respectively). Hence, our results revealed a subgroup HR1 of at risk children with a very similar performance to control subjects despite having 6 points less on the Family Blishen index than the latter (the mean score in the HR1 was 42.4 and in the control group was 48.4). Therefore, the socioeconomic status does not explain the finding of two clusters among the HR cohort nor the striking resemblance between the HR1 subgroup and the control subjects.
Finally, some neurocognitive dysfunctions have been reported as possible predictors of the progression to psychosis in UHR populations [15,33], and of deterioration of global functioning in early psychosis [34]. Furthermore, it has also been reported the existence of a link between cognitive difficulties and other psychiatric disorders like suicidal behavior and neurodegenerative diseases [1,2]. Thus, we could infer that, within the group of at risk patients, there already exists a distinction between those who have less chance of developing a psychiatric disease and those who could be at higher risk. Although it is important to mention that the aim of this present study was not to evaluate the relationship between cognitive dysfunctions and psychiatric disorders, future longitudinal studies should rather address this issue.
Considering that cognitive deficits are at the core of several major psychiatric illnesses, that appear early in children at genetic risk [10,16], and considering that a longer duration of untreated ‘at risk’ symptoms has been correlated with worse functioning [35], our present results clearly suggest that those who carry these deficits can be distinguished from the remaining who do not and thus should be targeted for future intervention research involving different cognitive remediation strategies.
Conclusion
To conclude, within a group of high risk offspring, we detected two subgroups different from each other in terms of neuropsychological performance; one was very similar to control subjects, whereas the other showed an important gap compared to control individuals, with effect sizes that even reached 2.3. Overall, these effect sizes tended to exceed those previously reported in HR studies, which could be explained, at least partially, by our approach that aimed to disentangle the two underlying cognitive susceptibility profiles. Still, further research is needed in longitudinal studies to investigate whether these findings are associated with the transition to a psychiatric disorder in the following years. Nevertheless, our study suggests that interventions with a neurocognitive target should be addressed earlier, due to the apparition of a breach in performance even at early stages in life.
Acknowledgement
This work was supported by the Canadian Institute of Health Research (CIHR). The authors have nothing else to declare.
We are grateful to family members, children and young adults who have participated in this study. We also thank our professional research assistants Linda René, Marie-Claude Boisvert, Valérie Beaupré, Daphné Lussier and Joanne Lavoie.
REFERENCES
- Etindele Sosso FA. Neurocognitive Game between Risk Factors, Sleep and Suicidal Behaviour. Sleep Sci. 2017;10(1)41-6.
- Faustin A. Brain Disorders: Correlation between Cognitive Impairment and Complex Combination. Mental Health Family Med. 2016;12:215-22.
- Gilbert E, Merette C, Jomphe V, et al. Cluster analysis of cognitive deficits may mark heterogeneity in schizophrenia in terms of outcome and response to treatment. Eur Arch Psychiatry Clin Neurosci. 2014;264(4):333-43.
- Moritz S, Klein JP, Desler T, et al. Neurocognitive deficits in schizophrenia. Are we making mountains out of molehills? . Psychol Med. 2017;47(15):2602-12.
- Fatouros-Bergman H, Cervenka S, Flyckt L, et al. Meta-analysis of cognitive performance in drug-naive patients with schizophrenia. Schizophr Res. 2014;158(1-3):156-62.
- Bora E, Pantelis C. Meta-analysis of Cognitive Impairment in First-Episode Bipolar Disorder: Comparison with First-Episode Schizophrenia and Healthy Controls. Schizophr Bull. 2015;41(5):1095-104.
- Bora E, Yucel M, Pantelis C, et al. Meta-analytic review of neurocognition in bipolar II disorder. Acta Psychiatr Scand. 2011;123(3):165-74.
- Maziade M, Rouleau N, Gingras N, et al. Shared neurocognitive dysfunctions in young offspring at extreme risk for schizophrenia or bipolar disorder in eastern quebec multigenerational families. Schizophr Bull. 2009;35(5):919-30.
- Maziade M, Rouleasu N, Merette C, et al. Verbal and visual memory impairments among young offspring and healthy adult relatives of patients with schizophrenia and bipolar disorder: selective generational patterns indicate different developmental trajectories. Schizophr Bull. 2011;37(6):1218-28.
- Maziade M, Rouleau N, Cellard C, et al. Young offspring at genetic risk of adult psychoses: the form of the trajectory of IQ or memory may orient to the right dysfunction at the right time. PLoS One. 2011;6(4):e19153.
- Ucok A, Direk N, Koyuncu A, et al., Cognitive deficits in clinical and familial high risk groups for psychosis are common as in first episode schizophrenia. Schizophr Res. 2013;151(1-3):265-9.
- de la Serna, E, Vila M, Sanchez-Gistau V, et al. Neuropsychological characteristics of child and adolescent offspring of patients with schizophrenia or bipolar disorder. Prog Neuropsychopharmacol Biol Psychiatry. 2016;65:54-9.
- Hou CL, Xiang YT, Wang ZL, et al. Cognitive functioning in individuals at ultra-high risk for psychosis, first-degree relatives of patients with psychosis and patients with first-episode schizophrenia. Schizophr Res. 2016;174(1-3):71-6.
- Rasic D, Hajek T, Alda M, et al. Risk of mental illness in offspring of parents with schizophrenia, bipolar disorder, and major depressive disorder: a meta-analysis of family high-risk studies. Schizophr Bull. 2014;40(1):28-38.
- Fusar-Poli P, Bonoldi I, Yung AR, et al. Predicting psychosis: meta-analysis of transition outcomes in individuals at high clinical risk. Arch Gen Psychiatry. 2012;69(3):220-9.
- Paccalet T, Gilbert E, Berthelot N, et al. Liability indicators aggregate many years before transition to illness in offspring descending from kindreds affected by schizophrenia or bipolar disorder. Schizophr Res. 2016;175(1-3):186-92.
- Mesholam-Gately RI, Giuliano AJ, Goff KP, et al. Neurocognition in First-Episode Schizophrenia: A Meta-Analytic Review. Neuropsychology. 2009;23(3):315-36.
- Fioravanti M, Bianchi V, Cinti M.E. Cognitive deficits in schizophrenia: an updated metanalysis of the scientific evidence. BMC Psychiatry. 2012;12(1):64.
- Cannon M, Caspi A, Moffitt TE, et al. Evidence for early - childhood, pan-developmental impairment specific to schizophreniform disorder: results from a longitudinal birth cohort. Arch Gen Psychiatry. 2002;59(5):449-56.
- Niendam TA, Sanchez LE, Hadley T, et al. A prospective study of childhood neurocognitive functioning in schizophrenic patients and their siblings. Am J Psychiatry. 2009;160(11):2060-2.
- Murtagh F, Legendre P. Ward’s Hierarchical Agglomerative Clustering Method: Which Algorithms Implement Ward’s Criterion? J Classif. 2014;31(3):274-95.
- Wilkinson L. Chapter 4 - Cluster Analysis in Systat Manuals.
- SAS Institute Inc., SAS/STAT® 9.22 User’s Guide. 2010, SAS Institute Inc.: Cary, NC.
- Peng G, Lilly E. Testing Normality of Data using SAS® in Pharmaceutical SAS Users Group 2004. San Diego, California.
- SAS Institute Inc., Base SAS® 9.4 Procedures Guide: Statistical Procedures. 2014, SAS Institute Inc.: Cary, NC.
- George D, Mallery P. SPSS for Windows Step by Step: A Simple Guide and Reference, 17.0 Update. 2010, Boston, MA: Allyn & Bacon. 386.
- Blishen BR, Carroll WK, Moore C. The 1981 socioeconomic index for occupations in Canada. Canadian Rev Sociol. 1987;24:465-88.
- Choi SH, Kyeong S, Cho KIK, et al. Brain network characteristics separating individuals at clinical high risk for psychosis into normality or psychosis. Schizophr Res. 2017;190:107-14.
- Hauser M, Zhang JP, Sheridan EM, et al. Neuropsychological Test Performance to Enhance Identification of Subjects at Clinical High Risk for Psychosis and to Be Most Promising for Predictive Algorithms for Conversion to Psychosis: A Meta-Analysis. J Clin Psychiatry. 2017;78(1):e28-e40.
- Agerbo E, Sullivan PF, Vilhjalmsson BJ, et al. Polygenic Risk Score, Parental Socioeconomic Status, Family History of Psychiatric Disorders, and the Risk for Schizophrenia: A Danish Population-Based Study and Meta-analysis. JAMA Psychiatry. 2015;72(7):635-41.
- Virtanen M, Kawachi I, Oksanen T, et al. Socio-economic differences in long-term psychiatric work disability: prospective cohort study of onset, recovery and recurrence. Occup Environ Med. 2011;68(11):791-8.
- Brito NH, Piccolo LR, Noble KG, et al. Associations between cortical thickness and neurocognitive skills during childhood vary by family socioeconomic factors. Brain Cogn. 2017;116:54-62.
- Cannon TD, Changhong Yu, Jean A, et al. An Individualized Risk Calculator for Research in Prodromal Psychosis. Am J Psychiatry. 2016;173(10):980-88.
- Sawada K, Kanehara A, Sakakibara E, et al. Identifying neurocognitive markers for outcome prediction of global functioning in individuals with first-episode and ultra-high-risk for psychosis. Psychiatry Clin Neurosci. 2017;71(5):318-27.
- Fusar-Poli P, Meneghelli A, Valmaggia L, et al. Duration of untreated prodromal symptoms and 12-month functional outcome of individuals at risk of psychosis. Br J Psychiatry. 2009;194(2):181-2.


