Costs of healthy and unhealthy food in Argentina: 2002-2015
2 Unversidad Catolica de La Plata, Argentina, Email: vviego@criba.edu.ar
3 Departamento de Ciencias de la Salud, Universidad Nacional del Sur (National University of South-UNS), Argentina, Email: vviego@criba.edu.ar
Received: 06-Sep-2017 Accepted Date: Sep 22, 2017; Published: 29-Sep-2017
Citation: Viego V, Temporelli K, Cattaneo C, et al. Costs of healthy and unhealthy food in Argentina: 2002-2015 Appl Food Sci J. 2017;1(1):4-6.
This open-access article is distributed under the terms of the Creative Commons Attribution Non-Commercial License (CC BY-NC) (http://creativecommons.org/licenses/by-nc/4.0/), which permits reuse, distribution and reproduction of the article, provided that the original work is properly cited and the reuse is restricted to noncommercial purposes. For commercial reuse, contact reprints@pulsus.com
Abstract
Food prices may be responsible for the uprising trend in obesity figures, especially in low and medium income countries. We construct price indexes
of healthy and unhealthy food baskets in Argentina during the period 2002-2015. Results show that although the relative price of healthy food items have
decreased since 2006, the gap is still high, near 80%. We discuss the potential impact of fiscal stimulus (e.g. taxation or subsidies) on eating habits.
Keywords
Food price; Healthy food; Unhealthy fooD
Official poverty lines in Argentina are usually based on food baskets with low energetic values (near 2200 kcal daily). Also, nutritional composition of those baskets is poor. That feature may underestimate the true cost of healthy eating. Many studies examine the relationship between food prices and obesity [1,2]. Most of them conclude that prices exert only a minor role in obesity due to the low elasticity values of food consumption compared to price variations. Nevertheless, some remark that the strength of the relationship between prices and obesity increases in low income regions [3,4]. If this hypothesis proves to be true, the price gap between minimal and desirable quantities and quality of food may explain, at least in part, the uprising trend in obesity and overweight during the last decade in Argentina.
Objective
We analyze Argentina´s price trends of healthy and unhealthy food for the 2002-2015 periods.
Methods
Prices of two food baskets were considered: one used to estimate official poverty lines and the other showing desirable food items. Both baskets contained quantities of different food items consumed by an adult taken as a benchmark (a 30-40 year old man). We constructed price indexes for both baskets on a monthly basis for the 2002-2015 periods. We also analyzed price trends of 7 selected products from healthy (e.g. oil, mineral water, pumpkin, meat, fruit salad, apple, fish) and unhealthy (e.g. cookies, soft drinks, wheat flavor, potato, pizza, salami, sausages) baskets in order to identify specific price trends.
Results
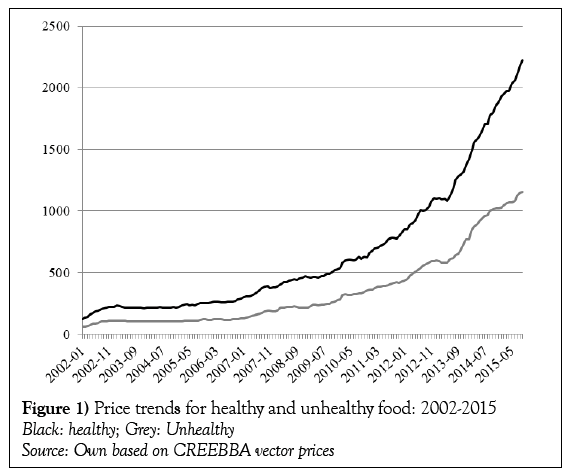
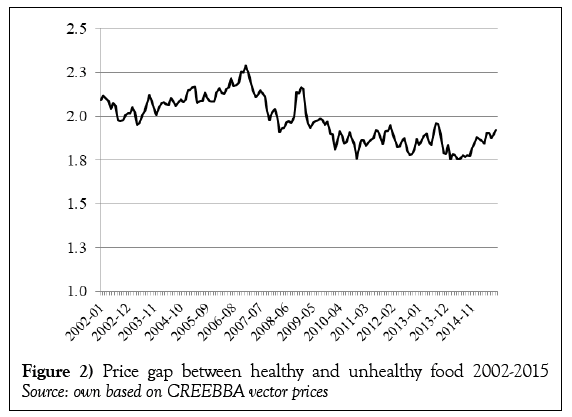
Historically, the healthy basket price has been about twice the unhealthy option (Figure 1). Also, the cost gap widened until late 2006. However, between 2007 and the end of 2010 the price of the healthy basket decreased relative to the other one. From 2011 to date the gap has been stable, around 80%; that is, acquiring the healthy basket for an adult costs on average 80% more than the unhealthy one (Figure 2). Products that lead the price variations are fish, meat, fruit salad, and pizza. The rest suffered lower price variations and similar evolution, especially since 2008.
Data and Materials
We consider food items included in the poverty line estimation used by the national statistics bureau (INDEC) [5] in Argentina. The healthy food basket was elaborated by a nutritionist who takes part in the research team. The prices of each item were provided by the Regional Center for Economic Studies of Bahia Blanca (CREEBBA).
Discussion
Targeted taxes (on fat items) had been proposed as a potential intervention to address the problem of obesity trends [6]. In fact, Denmark introduced such policy in 2011 for items containing greater than 2.3% saturated fat but abolished it one year later. Besides from regressive concerns [7,8], the effectiveness of food taxes to induce changes in dietary habits has been questioned; Finkelstein et al. [2] show that fiscal stimulus (taxation/ subsidies) has negligible effect on food consumption. Anyway, as Andreyeva et al. [1] point out, price elasticities are rather low, but they are usually computed under normal market conditions and for average households, masking the effect of food prices on diet under economic recessions and/or poor households, where obesity and overweight figures seem to be higher [9]. So, although targeted food taxes may not change food choices in aggregated demand, they may produce food intake shifts in low income households, where obesity and overweight tend to be higher.
In Argentina the notable price gap between healthy and unhealthy food show that a fiscal stimulus on food would lead to similar poor results than those find in empirical research conducted in developed countries. The rate needed to reduce or reverse price levels and therefore induce significant shifts in food consumption is substantial. Also, the scope of food taxes has to be sufficient in order to offset substitution effects between unhealthy food and other cheaper unhealthy options [10].
Conclusion
Recent uprising figures in obesity and overweight in adult population in Argentina may be explained by food prices. Although healthy food prices have decreased relative to unhealthy options since 2006, its actual level is still high: eating healthy products is on average 80% more expensive than eating unhealthy options.
REFERENCES
- Andreyeva T, Long M, Brownell K. The impact of food prices on consumption: A systematic review of research on the price elasticity of demand for food. Am J Public Health. 2010;100(2):216-22.
- Finkelstein E, Strombotne K, Zhen CH, et al. Food prices and obesity: A review. Adv Nutr. 2014;5:818-21.
- Asfaw A. Do government food price policies affect the prevalence of obesity? Empirical evidence from Egypt. World Dev. 2007;35(4):687-701.
- Powell L, Chalupka F. Food prices and obesity: Evidence and policy implications for taxes and subsidies. Milbank Q. 2009;87(1):229-57.
- INDEC. Canasta básica alimentaria y canasta básica total: historia, forma de cálculo e interpretación. 2012. Available at: http://www.indec.gov.ar/ftp/cuadros/sociedad/informe_canastas_basicas.pdf. Visited 25th Aug 2016.
- WHO (2008-2013). Action plan for the global strategy for the prevention and control of non-communicable diseases, WHO: Geneva. 2008.
- Allais O, Bertail P, Nichèle V. The effects of a fat tax on French households’ purchases: A nutritional approach. Am J Agric Econ. 2010;92(1):228-45.
- Smith T, Lin B, Lee JY. Taxing caloric sweetened beverages: Potential effects on beverage consumption, calorie intake and obesity. Economic Research Report No. 100. U.S. Department of Agriculture, Economic Research Service, July. 2010.
- Ziraba A, Fotso J, Ochako R. Overweight and obesity in urban Africa: A problem of the rich or the poor? BMC Public Health 2009;9:46-55.
- Ribaudo M, Shortle J Can taxing sugary soda influence consumption and avoid unanticipated consequences? Choices. 2011;26. Available at: http://ageconsearch.umn.edu/bitstream/117064/2/cmsarticle_192.pdf. Visited 26th Sept, 2017.


