Diagnosis by visualizing blood data -multiple myeloma
Received: 11-May-2023, Manuscript No. puljpam-23-6420; Editor assigned: 13-May-2023, Pre QC No. puljpam-23-6420 (PQ); Accepted Date: May 29, 2023; Reviewed: 15-May-2023 QC No. puljpam-23-6420 (Q); Revised: 17-May-2023, Manuscript No. puljpam-23-6420 (R); Published: 31-May-2023, DOI: 10.37532/2752-8081.23.7(3).189-192
Citation: Choi E. Diagnosis by visualizing blood data-multiple myeloma. J Pure Appl Math. 2023; 7(3):189-192.
This open-access article is distributed under the terms of the Creative Commons Attribution Non-Commercial License (CC BY-NC) (http://creativecommons.org/licenses/by-nc/4.0/), which permits reuse, distribution and reproduction of the article, provided that the original work is properly cited and the reuse is restricted to noncommercial purposes. For commercial reuse, contact reprints@pulsus.com
Abstract
Multiple myeloma is a type of cancer that is difficult to diagnose early due to its vague symptoms, which can lead to misdiagnosis or possibly mistaken for other diseases. When the symptoms are visible, multiple myeloma may reach an advanced cancer stage if there are no other appropriate treatments options left. This study proposes a method for the diagnosis of multiple myeloma through basic blood and urine tests by utilizing radar charts to increase readability and help rational decision-making for patients and doctors. The radar chart is the optimal way to visualize numeric values. As a result of visualizing the radar chart as a graph, a clear visual and morphological difference was found compared to normal people.
Key Words
Blood cancer; Multiple Myeloma; Early Diagnosis; Classification; Data Visualization; Decision-Making
Introduction
Many scholars and medical scientists have long developed laboratory techniques for diagnosing various methods to define diseases from a single drop of blood. This study began with the question of whether it is possible to interpret the numerical results of blood and urine tests in addition to laboratory techniques. In this paper, a visualization method is proposed based on the values derived from basic blood and urine tests to diagnose Multiple Myeloma (MM).
MM is a type of hematological malignancy that is easily misdiagnosed and confused by other diseases, such as bone lesions, kidney disease, and anemia, or even considered part of aging. To diagnose MM, blood chemistry tests and urine tests should be performed first, and one of the quantitative immunoglobulin tests, electrophoresis, serum free light chains, and bone marrow biopsy as well as bone X-rays, CT scans, MRI scans, PET scans, and more tests should be examined to definitively diagnose MM. However, there is a chance to find MM early through routine blood tests that show an abnormally high amount of protein in the blood. Therefore, our study focused on the first step of the diagnostic method of the blood and urine test. Among the diagnostic criteria, features are selected only from possible results from blood and urine tests, which are high blood Calcium level (Ca), poor kidney function (creatine), and low red blood cell (RBC (Red Blood Cell), hemoglobin). The research method steps are collecting blood and urine test result data from target patients with/without symptoms and diagnosed with multiple myeloma, limited to before chemotherapy or under medicated treatment. Therefore, data were collected from 5 patients diagnosed with MM and 1 patient without any blood-related disease. After preprocessing the data, they were normalized to be suitable for transformation into the graph. Among the many graph styles, carefully selected radar charts that effectively show the status of blood test results inspired by the game character performance indicator graph are optimized for multivariate analysis and are useful for performance testing. The proposed method is expected to improve readability by visualizing the status of blood and urine test results, helping medical staff make quick decisions, and helping in early diagnosis.
Method
The method used is to visualize the blood and urine test results to Explore Data Analysis (EDA). Through exploratory analysis, it summarizes the method of data normalization and establishes a formula. First, blood and urine test results were collected from 5 patients with multiple myeloma. The blood and urine test result data was collected four times after the presenting symptoms. Comparison data were collected from blood and urine samples from women in their thirties who did not have blood-related diseases. Terminal patients and stage 1 patients were categorized among the collected patient data. Normalization of data is normalized to the same digit. Based on the normalized data, the graph is written on the radar chart, and the graph with the normal patient is compared and analyzed to make meaningful discoveries [1-3].
Data and Variables
The blood test data of the patient come from the open data source of the ‘Korea Federation of Multiple Myeloma Patients’. Reference values are from Konkuk University Medical Center. The condition of the collected patient is as follows. Blood data were collected from 5 patients who were diagnosed with multiple myeloma without treatment with drugs or chemotherapy. One patient had the results of 3 blood and urine tests within three months of diagnosis and died within eight months of diagnosis. One patient died within three months of diagnosis, and the other 3 patients had data from blood and urine tests diagnosed in the first stage of MM. The parameter values of each patient were White Blood Cells (WBCs), neutrophil SEG%, lymphocytes, monocytes, eosinophils, basophils, Red Blood Cells (RBCs), Hemoglobin (Hb), Hematocrit (Hct), mean corpuscular volume (MCV), Mean Corpuscular Hemoglobin Concentration (MCHC), Mean Corpuscular Hemoglobin (MCH), albumin, and Platelets (PLTs). In addition to creatine and calcium values, creatine indicates the condition of the kidneys, and Calcium (Ca) indicates broken bones Table 1 and Table 2.
TABLE 1 Patient’s parameter value list & reference value
| Blood | Decreased within 1 year | Stage 1 | Norm | Avg. of patient 1~2 | Avg. of Stage 1 patients. | Reference value | ||||||
|---|---|---|---|---|---|---|---|---|---|---|---|---|
| p1 | p1-1 | p1-2 | p2 | p6 | p7 | p8 | p10 | G_Low | G_High | |||
| WBC | 6.3 | 6.4 | 6.66 | 4.24 | 3.15 | 5.56 | 4.2 | 4.2 | 4.3 | 5.9 | 4 | 10 |
| RBC | 3.63 | 4.2 | 3.6 | 2.78 | 3.1 | 4.32 | 3.17 | 3.94 | 3.5 | 3.6 | 4 | 5.4 |
| Hb | 11.9 | 13.8 | 11.7 | 8 | 9.9 | 13.5 | 10.1 | 12.6 | 11 | 11 | 11.5 | 14.5 |
| Hct | 34 | 39.9 | 34.2 | 24.9 | 29.9 | 40.6 | 30.9 | 37.9 | 34 | 33 | 36 | 48 |
| MCV | 93.7 | 95.5 | 95 | 89.6 | 96.5 | 94 | 97.5 | 96.3 | 96 | 93 | 80 | 98 |
| MCH | 32.8 | 33 | 32.5 | 28.6 | 31.9 | 31.3 | 31.9 | 30 | 32 | 32 | 26 | 32 |
| MCHC | 35 | 34.6 | 34.2 | 32 | 33.1 | 33.3 | 32.7 | 33.1 | 33 | 34 | 32 | 36 |
| PLT | 169 | 180 | 164 | 136 | 156 | 185 | 249 | 194 | 197 | 162 | 140 | 400 |
| Neutrophil seg% | 68.9 | 50.9 | 56 | 52.3 | 56.2 | 51.1 | 28 | 51.2 | 45 | 57 | 50 | 75 |
| Lymphocyte | 20.8 | 35.3 | 32.7 | 38.4 | 34.6 | 37.9 | 56.3 | 38.4 | 43 | 32 | 20 | 44 |
| monocyte | 9.8 | 11.4 | 10.5 | 6.2 | 7.9 | 9.4 | 9 | 7.2 | 8.8 | 9.5 | 2 | 9 |
| Eosinophil | 0.2 | 2.2 | 0.5 | 1.1 | 1.3 | 1.1 | 1.7 | 2.4 | 1.4 | 1 | 0 | 5 |
| Basophil | 0.3 | 0.2 | 0.3 | 0.4 | 0 | 0.5 | 0.9 | 0.8 | 0.8 | 0.3 | 0 | 2 |
| Albumin | 3.6 | 3.9 | 3.8 | 3.9 | 4.8 | 4.2 | 4.12 | 4.2 | 4.4 | 3.8 | 3.8 | 5.3 |
| Creatine | 0.64 | 0.67 | 0.76 | 0.89 | 0.96 | 1.18 | 0.83 | 0.57 | 1 | 0.7 | 0.5 | 0.9 |
| Ca | 11.9 | 9.3 | 9.5 | 9.3 | 9.4 | 9.7 | 9.3 | 9.3 | 9.4 | 10 | 8.6 | 10.1 |
TABLE 2 Patient list and conditions
| No. | Patient list | Conditions | Symptoms |
|---|---|---|---|
| 1 | Patient 1 | first blood & urine tests after leg pain occur | Y |
| 2 | Patient 1-1 | Patient 1's second blood & urine tests result after chest pain occur | Y |
| 3 | Patient 1-2 | Patient 1's third blood & urine tests result: Decreased after 8 months after the tests | Y |
| 4 | Patient 2 | Decreased: diagnosis after 3 months | Y |
| 5 | Patient 6 | Diagnosis as Stage 1, No symptoms but failed to collect stem cell | N |
| Patient 7 | Diagnosis as Stage 1, No symptoms | N | |
| 6 | Patient 8 | Diagnosis as Stage 1, Bone broke | Y |
| 7 | Patient 10 | Normal, No blood related diseases |
Data Normalization
For accurate comparative analysis, it is necessary to normalize each patient’s parameter values of various parameters (1 to 100 units). The normalization of the data was applied according to the percentage method due to the existence of an international standard reference value for normal values of blood and urine. The conversion of the percentage method is to visualize a graph round as possible for normal patient blood and urine test results. Additionally, see what percentage of blood is composed of the maximum value based on the reference value. By exploring patient data before conversion, we found that most of the patient values were lower than the lowest reference value. Distinctively at the RBC parameter’s each patient’s value, 5 out of 7 patients are under the lowest reference value, and we Hct. Only monocytes hit above the highest reference value. Therefore, to normalize the data, we selected the highest reference value to convert into a percentage. For the formula, the P- value is each patient’s parameter value, and the R-value is the reference value.
Explanation of Test Results I
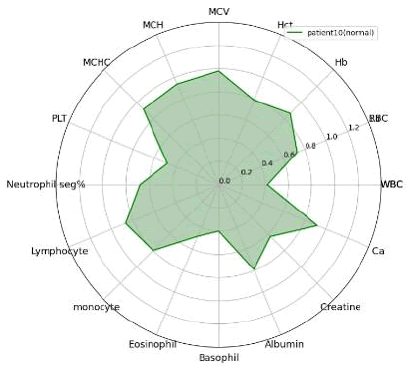
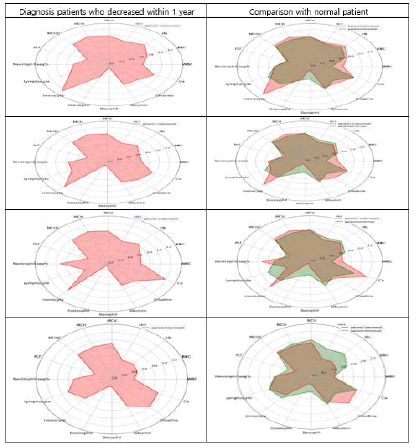
The method of analyzing the results is as follows. First, the difference between within-1-year terminal MM patients and normal patients was compared. Then, we compared the average value of the late hematological patients with normal patients (Figure 1), a healthy woman in her early 30 s. It is to compare some symptoms with a graph and normal patients and find a significant difference. The second compares symptom patients’ and normal patients’ graphs. The third expresses the graphs that obtain the average value of terminal cancer patients and the graphs of symptoms.
Explanation of Test Results II
Patient 1's data are a good example of changes in blood and urine parameters over time. A total of 3 blood and urine tests were conducted within 3 months, and the results are graphs applied as a conversion of percentage for the method of this study. The first graph shows the period in which painkillers and rehabilitation treatment were used for lower leg bone pain. The second and third graphs show the times when patients complained of severe chest pain and back and leg pain. In the third graph, multiple myeloma was identified. Compared to the graph of a normal person, the white blood cell value of a normal person is 0.42 points, which is 0.22 points higher than the value of Patient 1 (0.64 points). Compared to normal patients, albumin, creatine, and calcium segments showed a v shape of low creatine values. in patient 1 and 1-1,1-2 graphs noticeably increased in creatine and calcium levels over time. Other characteristics include neutrophil segmentation %, lymphocytes, and lymphocyte segment area rising like mountains in the case of monocyte sections. Through the 3rd examination, it can be seen that the dent in the opposite direction of the normal patient is more clearly visible, and the depth becomes deeper over time. Another characteristic is that RBCs decrease and WBCs increase. In addition, remarkably low basophils (almost 0 value) and low PLT were observed, and albumin, creatine, and calcium fragments previously seen in patient 1 protruded in the opposite direction (Figure 1).
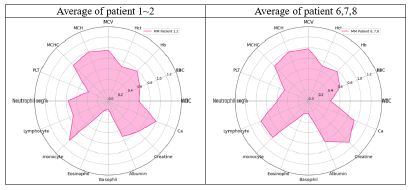
Finally, the average value of patients for each stage was obtained, and the visualization method proposed in this study was applied. There was no significant difference between the shape of the graph of the terminally ill patient and the stage 1 patient as shown in Figure 2 and Figure 3.
Conclusion
This study was designed to diagnose multiple myeloma, a blood cancer that is difficult to diagnose, by reprocessing and visualizing primary data. Through visualization, the difference in graph form between normal patients and multiple myeloma patients was clearly found, and even when substituting asymptomatic patients, there was a large difference between normal patients, especially in the parameters of platelet, creatinine, WBC, and neutrophil segmentation % level. Therefore, not only saving many people’s lives, this study can provide opportunities for early diagnosis and treatment to patients who miss treatment opportunities by misdiagnosis and is expected to contribute to readability and prompt or rational decision-making for medical staff by visually expressing numerical values. In addition, it is expected that false diagnoses can be reduced by preventing various diseases through early diagnosis or quickly determining the need for a second examination. In addition, the visualization of blood is expected to further improve communication between patients and medical staff. Although this study was limited to a blood disease, multiple myeloma, it is expected to become a starting point for early diagnosis of various diseases by visualizing the state of blood and changing the parameter settings, which are diagnostic criteria for other cancer patients.
References
- Anderson KC, Alsina M, Atanackovic D, et al. NCCN guidelines insights: multiple myeloma. J Natl Compr Canc Netw. 2016;14:389-400
- Korea Federation of Multiple Myeloma Patients. [Google Scholar][Crossref]
- Konkuk University Medical Center. [Google Scholar][Crossref]


