Distribution of Mercury in Flint Creek Watershed: Implications for Mercury Bioaccumulation
2 College of Agricultural, Life and Natural Sciences, USA
3 College of Agricultural, Life and Natural Sciences, Alabama A&M University, USA
Received: 20-Mar-2020 Accepted Date: Jun 08, 2020; Published: 15-Jun-2020
Citation: Okweye P, Golson-Garner K, Moss E. Distribution of Mercury in Flint Creek Watershed: Implications for Mercury Bioaccumulation. J Environ Chem Toxicol 2020;4(2):1.
This open-access article is distributed under the terms of the Creative Commons Attribution Non-Commercial License (CC BY-NC) (http://creativecommons.org/licenses/by-nc/4.0/), which permits reuse, distribution and reproduction of the article, provided that the original work is properly cited and the reuse is restricted to noncommercial purposes. For commercial reuse, contact reprints@pulsus.com
Abstract
Water, soil/sediment, and 36 fish samples were collected at three major sites along Flint Creek in 2015-2016 and analyzed for Total Organic Carbon (TOC), Dissolved Organic Carbon (DOC), Total Mercury (tHg), and other water quality indicators. This study was a follow-up to a 2012 study that revealed elevated tHg levels in fish, resulting in a public health advisory. This study revealed tHg concentrations in water below the detection limit (0.0002 ppm); while, tHG in soil/sediment ranged from <0.0133 ppm to 0.0682 ppm dry weight. No temporal trends existed, but tHG tended to increase with TOC. Mercury levels in sediment were below the threshold effects level suggested as a preliminary screening level by the National Oceanic and Atmospheric Administration (Acute = 1.4, Chronic = 0.77 ppb). In summary, tHg levels were low; posing little risk to drinking water. Soil/sediment levels were generally higher and could pose risk to aquatic species.
Keywords
Flint creek; Mercury; Water quality; Fish; Soil; Sediment; Organic carbon; Methyl-mercury
Introduction
Mercury (Hg) is a naturally occurring metal found primarily in Cinnabar (Mercury-sulfate) that is released through the weathering of rock and (or) volcanic activity [1]. However, the main source of Hg in the environment is from human activity through coal-combustion electrical power generation and industrial waste disposal and probably coal burning power plants in Alabama [2].
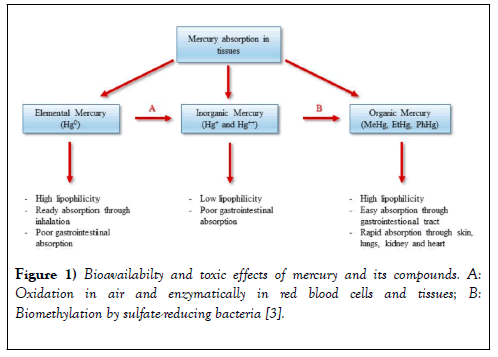
Environmental concentrations can be influenced by proximity to point sources such as sewage treatment plants and industrial discharges, and by geographic and physiographic factors that affect vulnerability to atmospheric deposition. Once Hg is released to the environment, it can be converted to a biologically toxic form of Methyl-mercury (MeHg) by microorganisms found in soil and in the aquatic environment [1]. According to the study, the bioavailability and toxic effects of mercury and its compounds in both fish and human are shown below Figure 1:
MeHg is a potent neurotoxin that affects the central nervous system causing neurological damage, mental retardation, blindness, deafness, kidney malfunction, and in some cases, death [3,4]. In recent years, there has been increasing recognition that methylmercury affects fish and wildlife health, both in acutely polluted ecosystems and ecosystems with modest methylmercury levels. A study by U.S. researcher Peter Frederick suggests methylmercury may increase male homosexuality or non-sexual psychological disorder in birds. Methylation of Hg is of concern because MeHg is absorbed easily into the food chain [3,4].
MeHg readily crosses biological membranes and can accumulate to harmful concentrations in the exposed organism and biomagnify up the food chain [5]. This biomagnification can cause high levels of Hg in top predator fishes and have a detrimental effect on humans and fish-eating wildlife [5,6]. Bioavailabilty and toxic effects of mercury and its compounds.
Materials and Methods
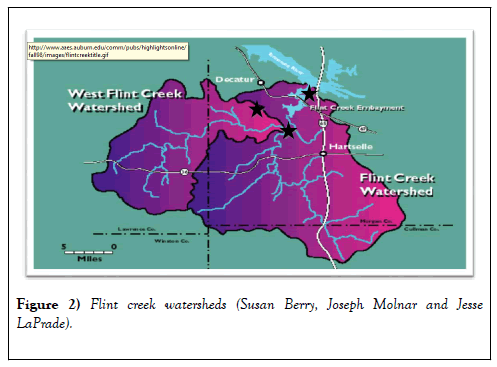
Within the Flint Creek Watershed, a total of 3 major sites were sampled for a combination of thirty-six fish (i.e., catfish, largemouth bass, and bream), surface water, soil and bed sediments (Table 1 and Figure 2), and other factors thought to influence Total Mercury (tHg). The samples were collected from May 2015 during moderate to high-flow conditions through August 2016 during low-flow conditions.
| Site # | Starting Point On Flint Creek | Code | Geographical Area |
|---|---|---|---|
| 1 | Red Bank | RB | Upland near Wetland |
| 2 | Vaughn Bridge | VB | Mid-Stream |
| 3 | Highway 31 | US31 | Lower-Stream -Tributary |
Table 1: Major sampling sites.
Sites were selected to represent watersheds dominated by agricultural, highly forested, and urban land uses throughout much of the study area and several tributaries draining into parts of the Tennessee River Basin.
Samples were collected at times of low water flow for streams such as Flint Creek to allow for sampling of more undisturbed sediments. Besides water samples, fish from the watershed were caught and analyzed because fish are good bio-indicators; they are at the top of the aquatic food web and are consumed by humans, making them important for attempts to assess contamination.
Composite surface water samples were collected randomly from the three predetermined sites along the Flint Creek. The water samples were analyzed for Total Organic Carbon (TOC), Dissolved Organic Carbon (DOC), Total Mercury (tHg), and other water quality parameters.
This study is a follow-up to a fish sampling study conducted in the same reach in September 2012-2013 by the Alabama Department of Environmental Management (ADEM) at site # 3 (US31) [7]. Those results showed mercury levels slightly elevated in fish over regulatory standards and levels from fish in disturbed and undisturbed streams nationwide, resulting in a public health advisory for largemouth bass.
This sampling was conducted to assess the presence or absence of mercury in fish (12 each of largemouth bass, bream, and catfish), and the water system.
A total of thirty-six fish {three species; 12 each of largemouth bass (Micropterus salmoides); bream (Acanthopagrus); and catfish (disambiguation)} and 102 samples (36 for soil/sediment; 36 for surface water; and 30 samples for TOC/DOC) were collected directly into cleaned, pretested, fluoropolymer glass bottles using sample handling techniques designed for collection of mercury at trace levels [5]. The samples were filtered through a 0.45 cm capsule filter prior to preservation. The samples were preserved by adding 5 mL of pretested 12 M hydrochloric acid (HCl) solution. Furthermore, water quality information was also measured at each sampling point to include the following physicochemical parameters: Water temperature, and pH.
The above parameters were measured in the field because the mercury methylation process is driven by these additional constituents and it is important to know their concentration to fully assess the significance of mercury concentrations in soil/sediments and water. Surface water samples were analyzed for tHg concentration using Cold Vapor Atomic Fluorescence Spectroscopy (CVAFS) at the ETC Lab, in Memphis, Tennessee [1].
Method Quantitation Limits (MQL) for concentrations of tHg in water was 0.0002 mg/L [8]. Soil/Bed-sediment samples were analyzed for concentrations of tHg using the CVAFS technique at the ETC Lab. These samples were predigested with nitric and sulfuric acids in a sealed teflon pressure vessel at 125°C for a minimum of 2 hours.
The cooled sample was then diluted with a 5-percent bromochloride solution and oxidized at 50°C for a minimum of 12 hours [9]. The MQLs for tHg in soil and bed sediments were 0.0133 and 0.0133 mg/Kg, respectively [8]. Fish-fillet samples were placed into acid-washed borosilicate glass jars and freeze-dried. The dry product was homogenized and digested in a sealed teflon pressure vessel with microwave heating and the addition of nitric and hydrochloric acid, followed by hydrogen peroxide.
Cold-vapor atomic absorption spectrophotometry with flow injection sample introduction and stannous chloride reduction was used to determine the concentration of tHg in the sample. A full description of laboratory procedures can be found in study [10].
The analytical data was validated using standard quality control measures as required by the applied analytical method. Quality assurance, instrumentation maintenance and calibration were performed in accordance with guidelines established by USEPA, NELAP (National Environmental Laboratory Accreditation Program) and USACE (U.S. Army Corps of Engineers).
Results
Prior to data analysis, a Pearson correlation was run on the environmental data. This was done to reduce the multi-collinearity within the data set (the coefficient estimates did not change erratically). The correlated variable with fewer data points or that was less normally distributed was removed from the data set. The remaining variables were analyzed using statistical and graphical approaches.
Fish-fillet data used for statistical (and graphical) analyses were limited to largemouth bass, bream and catfish. Limiting certain analyses to the largest single-species data set avoided the problem of interspecies differences in metabolism and in Hg accumulation rates [6,10]. For sites having specimens ranging in size the laboratory separated specimens into three separate batches prior to analysis.
In these cases, only the sample with the larger mean length was retained for inclusion in this study. Hg concentrations in largemouth bass fillets were normalized to mean sample total length prior to statistical and graphical analyses. Total length is related to age of fish, which has been shown in other studies [11] to influence Hg concentrations.
Concentration of tHg in bed sediment was normalized to Loss on Ignition (LOI). Loss on ignition represents the mass of moisture and volatile material present in a sample.
Distribution and concentrations of total mercury
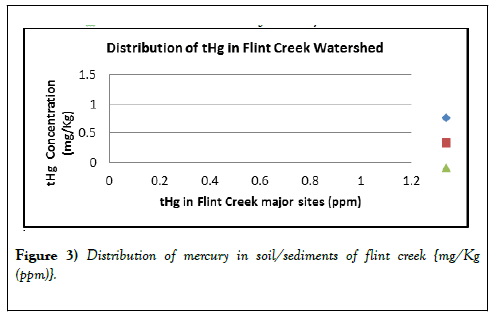
Fish tissue, water, and soil/bed-sediment samples were obtained from streams throughout the Flint Creek. The US31 site was the northernmost site. Red Bank site was the southernmost site, with Vaughn Bridge site in the middle (Figure 3).
Patterns of distribution
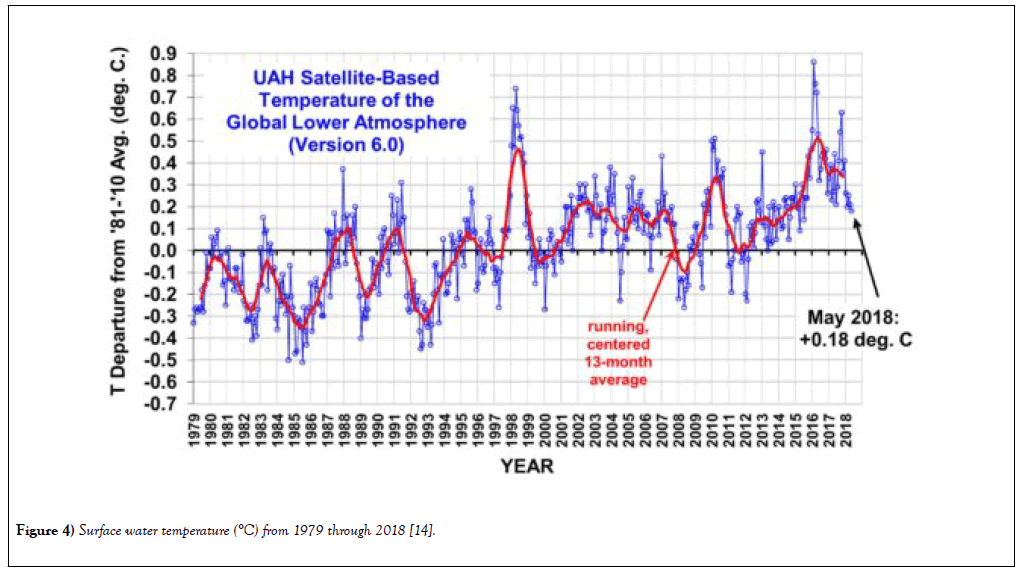
The distribution of Hg was somewhat variable throughout the watershed (Figure 4). Fish-tissue concentrations that exceeded human health and wildlife criteria were found in the urbanized north and the forested south (Tables 2-5).
Figure 4: Surface water temperature (°C) from 1979 through 2018 [14].
| MQL | Red Bank | Vaughn Bridge | US31 | |
|---|---|---|---|---|
| 1 | 0.0133 | <0.0133 | 0.0203 | 0.0226 |
| 2 | 0.0133 | 0.0283 | 0.0397 | 0.0447 |
| 3 | 0.0133 | 0.0326 | 0.0348 | 0.0237 |
| 4 | 0.0133 | 0.0483 | 0.0375 | 0.0322 |
| 5 | 0.0133 | 0.0519 | 0.0515 | 0.0236 |
| 6 | 0.0133 | 0.0516 | <0.0133 | 0.0671 |
| 7 | 0.0133 | 0.0479 | 0.0272 | 0.0328 |
| 8 | 0.0133 | 0.0182 | 0.0186 | 0.0398 |
| 9 | 0.0133 | 0.0543 | 0.0203 | 0.0378 |
| 10 | 0.0133 | 0.0237 | 0.0418 | 0.0668 |
| 11 | 0.0133 | <0.0133 | 0.0258 | 0.0682 |
| 12 | 0.0133 | 0.018 | 0.0444 | 0.0601 |
Table 2: Distribution of mercury in soil/sediments of flint creek {mg/Kg (ppm)}.
| Red Bank | Vaughn Bridge | US-31 | ||||
|---|---|---|---|---|---|---|
| pH | Temp (°C) | pH | Temp (°C) | pH | Temp (°C) | |
| 1 | 11.11 | 22 | 12.26 | 18 | 11.29 | 20 |
| 2 | 11.04 | 21 | 12.11 | 18 | 11.3 | 20 |
| 3 | 11.14 | 21 | 12.24 | 18 | 11.23 | 20 |
| 4 | 11.21 | 21 | 12.22 | 19 | 11.32 | 20 |
| 5 | 11.23 | 21 | 12.24 | 19 | 11.24 | 20 |
| 6 | 11.18 | 20 | 12.12 | 18 | 11.24 | 20 |
| 7 | 11.09 | 20 | 12.11 | 18 | 11.35 | 20 |
| 8 | 10.98 | 21 | 12.06 | 19 | 10.28 | 21 |
| 9 | 11.24 | 20 | 11.92 | 19 | 11.36 | 21 |
| 10 | 11.31 | 20 | 11.81 | 19 | 11.34 | 21 |
| 11 | 11.34 | 20 | 11.71 | 20 | 11.13 | 21 |
| 12 | 11.32 | 21 | 11.65 | 20 | 11.26 | 21 |
Table 3: Relation between pH and temperature in flint creek in summer.
| MQL | TOC-RB | tHG-RB | TOC-VB | tHG-VB | TOC-US31 | tHG-US31 | |
|---|---|---|---|---|---|---|---|
| 1 | 1 | 5.54 | 0.0132 | 5.22 | 0.0203 | 6.4 | 0.0398 |
| 2 | 1 | 5.91 | 0.0283 | 4.97 | 0.0397 | 6.75 | 0.0378 |
| 3 | 1 | 5.78 | 0.0326 | 4.95 | 0.0348 | 7.91 | 0.0668 |
| 4 | 1 | 5.59 | 0.0483 | 5.19 | 0.0375 | 6.28 | 0.0682 |
| 5 | 1 | 5.67 | 0.0519 | 4.97 | 0.0515 | 6.46 | 0.0601 |
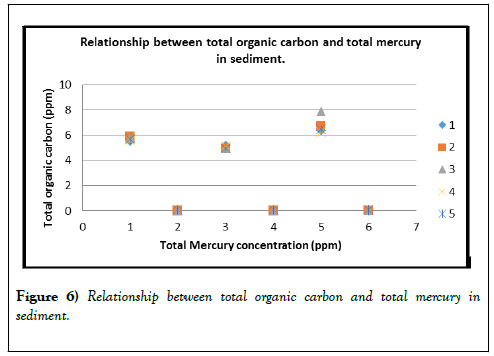
Table 4: Relationship between total organic carbon and total mercury in sediment.
| Site ID | pH | Site ID | pH | Site ID | pH |
|---|---|---|---|---|---|
| 1 | 7.06 | 5 | 7.16 | 9 | 6.91 |
| 2 | 6.76 | 6 | 5.78 | 10 | 6.88 |
| 3 | 7.56 | 7 | 6.88 | 11 | 6.73 |
| 4 | 6.96 | 8 | 5.92 | 12 | 7.07 |
Table 5: Water pH in flint creek during winter season.
A north-south plot of tHg concentrations in largemouth bass (Figure 4) indicates a pattern of higher length-normalized tHg concentrations in the northern section, an area of higher population density and industrialization, and in the southern section, an area of relatively low population density.
A north-south plot of tHg concentrations in largemouth bass (Figure 4) indicates a pattern of higher length-normalized tHg concentrations in the northern section, an area of higher population density and industrialization, and in the southern section, an area of relatively low population density.
The lowest concentrations tended to be at sites in the middle section of the study area (VB) (Tables 2-5).
Concentrations
Surface water tHg sample concentrations were less than the Detection Limit (0.0002 ppm). Soil/Bed-sediment sample tHg concentrations ranged from less than Detection Limit (0.0133 ppm) to 0.0682 ppm. The bed-sediment quality-control split samples showed better results than the surface water samples.
The Total Organic Carbon (TOC) sample had concentrations of 4.95 and 7.91 mg/L, and the Dissolved Organic Carbon (DOC) samples had concentrations of 4.71 and 7.67 mg/L.
Fish-tissue tHg concentrations ranged from 0.0125 to 0.0876 mg/g wet weight. The internal quality-control tests performed at the ETC Lab for fish tissue indicated good accuracy and precision except when sample concentrations were very low [3].
Method blanks were near or below the instrument detection limit for eight of the nine test blanks, resulting in a higher MQL of 0.0133 μg/g wet weights [10].
Concentrations of tHg were detected in 33 out of 36 soil and bed-sediment samples (Table 4); however, no detection was observed in the surface water, which may be a result of the detection limit.
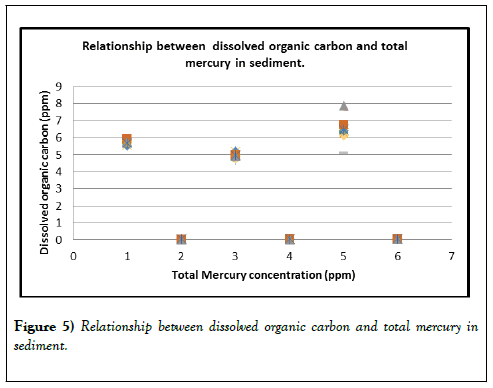
Additionally, sunlight can break down methylmercury to Hg (II) or Hg (0), which can leave the aquatic environment and reenter the atmosphere as a gas (Figures 5 and 6).
Factors controlling distribution of tHg
The large concentration of mercury in soil/sediments may be due to low pH (5.78-7.07, Table 6) and TOC (4.95-7.91, Table 7) anf high DOC (4.71-7.67 mg/L, Table 8). DOC and pH are two factors that affect methylation because they have strong effect on the ultimate fate of mercury in an ecosystem. Organic matter can stimulate microbial populations, reduce oxygen levels, and therefore increase biomethylation. Biomethylation increases in warmer temperatures such as this summer (18°C to 22°C, Table 3) when biological productivity is high, and decreases during the winter. In general, the form of mercury in the environment varies with the season.
| TOC/DOC in Surface Water (mg/L) | |||||
|---|---|---|---|---|---|
| Variables | MQL | Red bank | Vaughn Bridge | US31 | |
| 1 | TOC | 1 | 5.54 | 5.22 | 6.4 |
| 1 | DOC | 1 | 5.68 | 4.82 | 6.33 |
| 2 | TOC | 1 | 5.91 | 4.97 | 6.75 |
| 2 | DOC | 1 | 5.92 | 4.71 | 6.5 |
| 3 | TOC | 1 | 5.78 | 4.95 | 7.91 |
| 3 | DOC | 1 | 5.62 | 4.81 | 7.67 |
| 4 | TOC | 1 | 5.59 | 5.19 | 6.28 |
| 4 | DOC | 1 | 5.52 | 5.02 | 5.12 |
| 5 | TOC | 1 | 5.67 | 4.97 | 6.46 |
| 5 | DOC | 1 | 5.54 | 4.79 | 6.14 |
Table 6: Total Organic Carbon (TOC) and Dissolved Organic Carbon (DOC) during season.
| Variables | Criteria | RB | VB | US31 |
|---|---|---|---|---|
| LM Bass | 0.3 ppm | Average | Average | Average |
| 0.0434 | 0.0402 | 0.0456 | ||
| Bream | 0.3 ppm | Average | Average | Average |
| 0.0345 | 0.0498 | 0.0876 | ||
| Catfish | 0.3 ppm | Average | Average | Average |
| 0.034 | 0.0335 | 0.0125 |
Table 7: Concentration of tHg in Fish (ppm).
| Media | Mercury Standard | Explanation |
|---|---|---|
| Fish | 1 µg/g (1 mg/kg or 1.0 ppm) | FDA action level for methyl mercury. µg/g (1 mg/kg or 1.0 ppm) |
| Drinking Water | Maximum contaminant level=0.002 mg/L (0.002 ppm) | Maximum contaminant level for mercury established under the Safe Drinking Water Act |
Table 8: Mercury standards and explanations for fish and drinking water [12,13].
Studies have also shown that for the same species of fish taken from the same region, increasing the acidity of the water (decreasing pH) and/or the TOC/DOC (Table 8) content generally results in higher mercury levels in fish (bioaccumulation), an indicator of greater net methylation. Higher acidity and DOC levels in surface water enhance the mobility of mercury in the environment, thus making it more likely to enter the food chain.
Human-health and wildlife criteria
Fish-fillet tHg data were compared to human-health and wildlife criteria to assess potential effects in the Flint Creek watershed.
Concentrations of tHg in fish fillets did not exceed the USEPA humanhealth criteria of 0.3 μg/g wet-weight fillets in any of the samples from Flint Creek Watershed (Table 9) [12].
| Mercury in Surface Water (mg/L) | ||||
|---|---|---|---|---|
| MQL | Red bank | Vaughn Bridge | US31 | |
| 1 | 0.0002 | <0.0002 | <0.0002 | <0.0002 |
| 2 | 0.0002 | <0.0002 | <0.0002 | <0.0002 |
| 3 | 0.0002 | <0.0002 | <0.0002 | <0.0002 |
| 4 | 0.0002 | <0.0002 | <0.0002 | <0.0002 |
| 5 | 0.0002 | <0.0002 | <0.0002 | <0.0002 |
| 6 | 0.0002 | <0.0002 | <0.0002 | <0.0002 |
| 7 | 0.0002 | <0.0002 | <0.0002 | <0.0002 |
| 8 | 0.0002 | <0.0002 | <0.0002 | <0.0002 |
| 9 | 0.0002 | <0.0002 | <0.0002 | <0.0002 |
| 10 | 0.0002 | <0.0002 | <0.0002 | <0.0002 |
| 11 | 0.0002 | <0.0002 | <0.0002 | <0.0002 |
| 12 | 0.0002 | <0.0002 | <0.0002 | <0.0002 |
Table 9: Mercury in surface water (mg/L).
Discussion
Though the study showed that tHg in fish at this watershed did not exceed human health criteria, a public health advisory is still in effect that states- n Morgan County, people shouldn’t eat largemouth bass from Flint Creek, downstream of the West Flint Creek confluence in the vicinity of U.S. 31. People should limit consumption to two meals per month of largemouth bass from Limestone County, at Wheeler Reservoir, and one mile upstream (US31) of the confluence with the Tennessee River [2].
**A meal consists of 6 ounces of cooked fish or 8 ounces of raw fish. All three media-fish, water, and bed sediments-reflected an urbanization effect, but the relation for each was different. Because of the limited number of fish samples additional sampling would be needed to draw more precise conclusions (Table 10).
| MQL | DOC-RB | tHG-RB | DOC-VB | tHG-VB | DOC-US31 | tHG-US31 | |
|---|---|---|---|---|---|---|---|
| 1 | 1 | 5.68 | 0.0132 | 4.82 | 0.0203 | 6.33 | 0.0398 |
| 2 | 1 | 5.92 | 0.0283 | 4.71 | 0.0397 | 6.5 | 0.0378 |
| 3 | 1 | 5.62 | 0.0326 | 4.81 | 0.0348 | 7.67 | 0.0668 |
| 4 | 1 | 5.52 | 0.0483 | 5.02 | 0.0375 | 5.12 | 0.0682 |
| 5 | 1 | 5.54 | 0.0519 | 4.79 | 0.0515 | 6.14 | 0.0601 |
Table 10: Relationship between dissolved organic carbon (DOC) and total mercury (tHg) in sediment.
Conclusion
Total mercury concentrations in water in Flint Creek and its side channels were below the Detection Limits (0.0002 ppm) during the sampling period. Therefore, mercury levels in water in Flint Creek were well below the state and federal standards for drinking water. The site 3 (US31) likely experienced high rates of methylation as a result of stagnant conditions, especially during the July sampling.
Total mercury in soil/sediment in the sites ranged from <0.0133 ppm in Red Bank to 0.0682 ppm dry weight, with the highest levels observed at site #3 US31. No temporal trends existed, but mercury levels tended to increase with total organic carbon. Mercury levels in sediment were below the threshold effects level suggested as a preliminary screening level by National Oceanic and Atmospheric Administration (NOAA) (Acute = 1.4, Chronic = 0.77 ppb). In summary, mercury levels measured in water in Flint Creek were low and pose little risk to drinking water contamination, but mercury levels in soil/sediment were high and pose potential high risk to aquatic species in the river reaches. Mercury levels may be slightly elevated in TOC and DOC as a result of precipitations from waste incinerators, fossil fuel burning and various industrial operations in the area, but sampling efforts have not detected any large concentrations of mercury. 36 fish samples were used for the analysis, and the differences in tHg concentrations in the fish samples can be attributed to higher flows and mercury associated with increased sediment and organic material in the water. The current fish advisories in Flint Creek are the result of testing in fall, 2013. ADEM conducts testing on fish in the fall because chemicals are stored in fat, and fish have more fat in the fall [15-17].
Funding
This work is supported by the College of Engineering, Technology, and Physical Sciences, the USDA National Institute of Food and Agriculture’s (NIFA) Capacity Building Grant Program (#1012164), and the USDA Renewable Resources Extension Act Program (#1012197).
Acknowledgments
The authors would like to thank analysts and staff at the Waypoint Analytical Inc., Memphis, Tennessee for the sample analysis.
Conflicts of Interest
The authors declare no conflict of interest.
REFERENCES
- National Research Council. Toxicological effects of methylmercury. National Academies Press, 2000.
- Sahu SK, Bhangare RC, Tiwari M, et al. Depth profiles of lithogenic and anthropogenic mercury in the sediments from Thane Creek, Mumbai, India. International Journal of Sediment Research. 2014;29:431-439.
- Genchi G, Sinicropi MS, Carocci A, et al. Mercury exposure and heart diseases. International Journal of Environmental Research and Public Health. 2017;14:74.
- Fredrick P. Pollution making 'Male birds mate with each other': Scientists. Treehugger Technology, USA, 2010.
- US Environmental Protection Agency. Method 1669: Sampling ambient water for trace metals at EPA water quality criteria levels 1996.
- Goldstein DB, Zhivotovsky LA, Nayar K, et al. Statistical properties of the variation at linked microsatellite loci: implications for the history of human Y chromosomes. Molecular Biology and Evolution 1996;13:1213-1218.
- Alabama Fish Consumption Advisories. Alabama Department of Public Health (ADPH), Alabama Department of Environmental Management (ADEM), Alabama Department of Conservation and Natural Resources (ADCNR), and the Tennessee Valley Authority (TVA) 2015.
- Olson ML, DeWild JF. Techniques for the collection and species-specific analysis of low levels of mercury in water, sediment, and biota. InUS Geological Survey Toxic Substances Hydrology Program-Proceedings of the Technical Meeting, Charleston, SC, USA 1999;2:191-201.
- Krabbenhoft DP, Wiener JG, Brumbaugh WG, et al. A national pilot study of mercury contamination of aquatic ecosystems along multiple gradients. In: US Geological Survey Toxic Substances Hydrology Program Proceedings of Technical Meeting 1999;2:147-160.
- Besser JM, Brumbaugh WG, May TW, et al. Bioavailability of metals in stream food webs and hazards to brook trout (Salvelinus fontinalis) in the upper Animas River watershed, Colorado. Archives of Environmental Contamination and Toxicology 2001;40:48-59.
- Ward SM, Neumann RM. Seasonal variations in concentrations of mercury in axial muscle tissue of largemouth bass. North American Journal of Fisheries Management. 1999;19:89-96.
- Williams ML, MacCoy DE. Mercury concentrations in water and mercury and selenium concentrations in fish from Brownlee Reservoir and selected sites in the Boise and Snake Rivers, Idaho and Oregon, 2013-15. US Geological Survey. 2016.
- United States Environmental Protection Agency. Drinking water requirements for states and public water systems: Drinking Water Regulations.
- Latest Global Average Tropospheric Temperatures. University of Alabama in Huntsville, USA, 2018.
- Woernle C. Alabama Department of Public Health (ADPH) Fish. Consumption Advisories, USA, 2010.
- Bodaly RA, St. Louis VL, Paterson MJ, et al. Bioaccumulation of mercury in the aquatic food chain in newly flooded areas. Metal Ions in Biological Systems. 1997;34:259-288.
- Driscoll CT, Han YJ, Chen CY, et al. Mercury contamination in forest and freshwater ecosystems in the northeastern USA. BioScience 2007;57:17-28.


