Effect of Glyphosate Herbicide on Nitrogen Fixing Bacteria-Azotobacter Species
Received: 22-May-2020 Accepted Date: Jun 05, 2020; Published: 12-Jun-2020
Citation: Adero VO, Raju NS, Supreeth M. Effect of Glyphosate Herbicide on Nitrogen Fixing Bacteria-Azotobacter Species. J Environ Chem Toxicol 2020;4(2):1-7.
This open-access article is distributed under the terms of the Creative Commons Attribution Non-Commercial License (CC BY-NC) (http://creativecommons.org/licenses/by-nc/4.0/), which permits reuse, distribution and reproduction of the article, provided that the original work is properly cited and the reuse is restricted to noncommercial purposes. For commercial reuse, contact reprints@pulsus.com
Abstract
Background: Glyphosate, a broad-spectrum, nonselective, systemic herbicide, exists in the form of acid or salt and the most widely used herbicide in the world to control weeds especially grasses. It kills plants by interfering with the synthesis of the aromatic amino acids phenylalanine, tyrosine, and tryptophan in the shikimate pathway by inhibiting the enzyme 5-enolpyruvylshikimate-3-phosphate synthase (EPSPS), which catalyzes the reaction of shikimate-3-phosphate (S3P) and phosphoenolpyruvate to form 5-enolpyruvyl-shikimate-3-phosphate (EPSP). Azotobacter, a gram negative, genus of motile, oval or spherical shaped aerobic, free-living soil microbes, play important role in nitrogen fixation. The use of glyphosate to control weeds has been thought to have effects on the growth and survivability of Azotobacter and hence this study was carried out to assess these effects.
Methods: Soil samples were taken from the top layer (0-15 cm) of a sugarcane and rice field and Azotobacter species isolated using Ashby’s glucose agar then these were cultured using Ashby’s mannitol agar. The bacteria were identified by morphological characterization and biochemical characterization (catalase test) thereafter mass culturing was dine using Luria Bertani hi-veg broth and incubated for 24 hours. Assessment of effect of glyphosate on the bacteria was done using agar well method and soil amendments method.
Results: All 5 colonies isolated were gram negative rods to oval or coccoid in shape, catalase positive and appeared whitish slimy, raised and glistering, orange to red and grey to dark brown in colour. At higher concentrations, glyphosate 41%, (without dilution) had an inhibitory effect on the growth of Azotobacter but at field dose it does not inhibit their growth. At field dose or higher doses, (double dose or triple dose) glyphosate enhance the growth of Azotobacter.
Conclusion: The use of glyphosate to control weeds at field dose or slightly higher doses will have a growth enhancing effect on Azotobacter bacteria while at higher elevated concentrations it will have growth inhibiting effect.
Keywords
Nitrogen fixing bacteria; Azotobacter; Herbicide; Glyphosate
Introduction
With the rise in population after the preindustrial period, there was need to increase food production to meet the ever-increasing demand for food by the human population. This in turn led to agrarian revolution where farming was taken to the next level through extensive mechanization, tillage of large tracts of land and increased crop yield in turn [1]. However, as this intensification increased, soil potential and fertility drastically reduced with the rise in infestation of crops by pests and diseases. Therefore, there was need to control the pests and diseases and also to improve on soil fertility which gave birth to the emergence of synthetic fertilizers and pesticides [2]. As the global demand for food production increased with the ever-rising population, the demand for usage of chemical pesticides also continued to rise. Due to increased pest attacks on crops, about 45% of annual food production was lost and the global consumption of pesticides per year stood at about two million tons and among this, Europe is leading in consumption with 45%, followed by USA at 24% and the remaining 25% is consumed by the rest of the world. In the Asian continent countries, China is leading in pesticides consumption closely followed by Korea, Japan then India [3,4]. Indian farmers are using wide ranges of chemical pesticides to limit the losses from pests and diseases, in which insecticides account 73%, herbicide 14%, fungicides 11% and others 2%. Out of these, 40% of the pesticides used are organochlorine and 30% is of organophosphate category with the remaining percentage other forms of pesticides [3]. This was due to increased insect pest attack caused mainly by the prevailing warm humid climatic condition. From the changing conditions, it is inevitable that there would be a rise in attack of crops by pests and diseases hence reduced. The advances in agricultural sciences to date could not reduce the losses due to pests and diseases which have been ever increasing ranging from 10-90%, with an average of 35 to 40%, for all potential food and fiber crops [5].
Pesticides are classified into different groups based on their chemical composition including organochlorines, organophosphates, carbamates, formamidines, thiocyanates, organotins, denitrophenols, synthetic pyrethroids and antibiotics [6]. Commonly used organophosphate pesticides are parathion, malathion, methyl parathion, chlorpyrifos, glyphosate, diazinon, dichlorvos, phosmet, fenitrothion, tetrachlorvinphos, azamethiphos, and azinphos-methyl. Among the organophosphate, glyphosate herbicide is the most widely used in agricultural fields for the control of weeds especially the grasses since its inception in the 1970 with the main producers being USA followed by China, Japan and the fourth is India [4].
Glyphosate
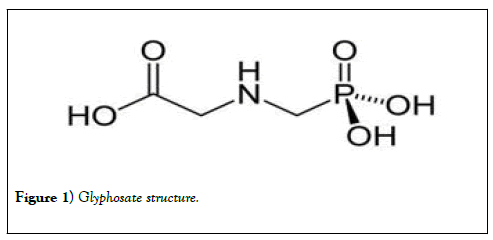
The herbicide N-(phosphonomethyl) glycine, commonly known as glyphosate, is a broad-spectrum, nonselective, systemic herbicide [7]. It is an organophosphorus compound, specifically a phosphonate. It is used to kill weeds, especially annual broadleaf weeds and grasses that compete with crops. It was discovered to be an herbicide by Monsanto chemist John E. Franz in 1970. Monsanto brought it to market in 1974 under the trade name roundup. Glyphosate is the most widely used herbicide in the world and its demand continues to grow [8]. Farmers quickly adopted it, especially after Monsanto introduced glyphosate-resistant roundup ready crops, enabling farmers to kill weeds without killing their crops [4].
Glyphosate has the following properties; chemical formula C3H8NO5P; molar mass 169.07 g•mol-1; appearance white crystalline powder; density 1.704 g/cm3 (at 20°C); melting point 184.5°C (364.1°F; 457.6 K); boiling point, decomposes at 187°C (369°F; 460 K); solubility in water 1.01 g/100 mL (at 20°C) and its acidity (pKa) <2, 2.6, 5.6, 10.6 [9] (Figure 1).
The half-life of glyphosate in soil ranges between 2 to 197 days; with the typical field half-life of 47 days. Its persistence in the soil is governed by several factors but majorly soil type and characteristics and the prevailing climatic conditions. The median half-life of glyphosate in water varies from a few to 91 days [10].
Glyphosate kills plants by interfering with the synthesis of the aromatic amino acids’ phenylalanine, tyrosine, and tryptophan in the shikimate pathway. It does this by inhibiting the enzyme 5-enolpyruvylshikimate-3- phosphate synthase (EPSPS), which catalyzes the reaction of shikimate-3- phosphate (S3P) and phosphoenolpyruvate to form 5-enolpyruvylshikimate- 3-phosphate (EPSP) [11,12]. It’s absorbed through foliage and minimally through roots, thereby only effective on actively growing plants and cannot prevent seeds from germinating [10]. After application, glyphosate is readily transported around the plant to growing roots and leaves and this systemic activity is important for its effectiveness [11,12]. The inhibition of the enzyme causes shikimate to accumulate in plant tissues and diverts energy and resources away from other processes. While growth stops within hours of application, it takes several days for the leaves to begin turning yellow.
Studies have been conducted to evaluate the environmental impacts of single glyphosate applications with the focus on microorganisms and nontarget organisms. A number of these studies have found that glyphosate has no significant effect on microbial community activity and composition, while other studies have also found that glyphosate has negative effects on the microbial community growth and survivability especially bacteria [2,13-16]. Reference reported that glyphosate is a chelating agent and its presence in the soil beyond the acceptable limits leads to undersupply of macro- and micronutrients which are essential for many plant processes including plant-microorganism interactions of which nitrogen fixation is one of them [17].
It has been reported recently that glyphosate has adverse effects on microorganisms, algae, and other aquatic organisms and repeated applications may have a greater impact on soil microorganisms than a single application [18]. It can be said that non-target organisms are always exposed to chemicals at low levels for a long period of which is the case with glyphosate application, which may also exert adverse biological effects comparable with those due to high doses [19]. Glyphosate can adversely affect microorganisms when applied in vitro. This result could be expected, since the shikimic acid pathway disrupted by glyphosate is present in bacteria and fungi. Given the large number and diversity of soil microorganisms (bacteria, fungi, actinomycetes, microalgae) that are present in agricultural soils, it is inevitable that any chemical or substrate applied to the soil will perturb the functional dynamics of some component of this microbial community [20]. Free living nitrogen fixing rhizobacteria play an important in ensuring the soil is enriched with the nitrogen needed for several processes in the plants and crops. Interference with these soil microorganisms will in turn lead to reduced nitrogen fixation which will lead to nitrogen deficiency in soil and soil fertility compromised.
Azotobacter
Azotobacter is a genus of usually motile, oval or spherical bacteria that form thick-walled cysts and may produce large quantities of capsular slime. They are aerobic, free-living soil microbes which play an important role in the nitrogen cycle in nature, binding atmospheric nitrogen, which is inaccessible to plants, and releasing it in the form of ammonium ions into the soil (nitrogen fixation) [21]. In addition to being a model organism for studying diazotrophs, it is used by humans for the production of biofertilizers, food additives, and some biopolymers.
Azotobacter genus is known to fix on an average 10 mg of N/g of carbohydrate under in vitro. A. chroococcum happens to be the dominant inhabitant in arable soils capable of fixing N2 (2-15 mg N2 fixed/g of carbon source) in culture medium. Most efficient strains of Azotobacter would need to oxidize about 1000 kg of organic matter for fixing 30 kg of N/ha. Besides, soil is inhabited by a large variety of other microbes, all of which compete for the active carbon. Plant needs nitrogen for its growth and Azotobacter fixes atmospheric nitrogen non-symbiotically. Therefore, plants get benefited especially cereals, vegetables, fruits, etc. are known to get additional nitrogen requirements from Azotobacter [22-25]. Owing to their ability to fix molecular nitrogen and therefore increase the soil fertility and stimulate plant growth, Azotobacter species are widely used in agriculture, particularly as nitrogen biofertilizers [26].
The objective of the study was to isolate Azotobacter strains from the rhizosphere soil, identify and characterize the Azotobacter strains isolated and to assess the effects of application of glyphosate herbicide on the growth and number of free-living nitrogen fixing bacteria; Azotobacter species.
Materials and Methods
Isolation and characterization of Azotobacter bacteria from the soil Soil sample collection
Soil samples were taken from the top layer (0-15 cm) of a sugarcane and rice field in Srirangapatna, Karnataka, India immediately placed in zip lock bags and taken to the laboratory. The soil was air dried and any visible organic residues were removed by hand then the soil was passed through a 2 mm sieve and stored waiting for use [27,28].
Isolation of Azotobacter bacteria from the soil
This was done using Ashby’s glucose agar containing in grams; glucose 2.0, dipotassium phosphate 0.02, magnesium sulphate 0.02, sodium chloride 0.02, potassium sulphate 0.01, calcium carbonate 0.5 and agar 1.5 in 100 mL distilled water; by the serial dilution method and incubated at 30 ± 20C for 24-48 hours then single colonies inoculated in Ashby’s manitol agar containing in grams; manitol 2.0, dipotassium phosphate 0.02, magnesium sulphate 0.02, sodium chloride 0.02, potassium sulphate 0.01, calcium carbonate 0.5 and agar 1.5 in 100 mL distilled water; and incubated for 24 hours at 30 ± 20C. Repeated sub-culturing of these colonies was done to get pure cultures which were subjected to morphological identification and biochemical characterization to identify and confirm whether they belong to Azotobacter genus [29].
Morphological characterization
Azotobacter species appear oval in shape but may take forms of rods, coccoids to spheres. The cells are motile due to numerous flagella. They appear milky, slimy, circular and raised and form cysts around cells. Some may appear white, dark grey or orange to red in colour. The normal gram staining procedure was followed to distinguish between gram negative and gram positive bacteria. Azotobacter species are gram negative rods to coccoid in shape which occur singly, in pairs or in irregular clumps [21].
Biochemical characterization (Catalase test)
Catalase test is done to differentiate between catalase positive and catalase negative bacteria. Catalase positive bacteria will produce frothing or gas bubbles when a drop of 3% hydrogen peroxide is added. Azotobacter species are catalase positive hence gas bubbles produced when H2O2 is added.
Mass-culturing of pure culture of Azotobacter strains
After confirmation that the bacteria isolated from the soil were Azotobacter species, mass culturing of three pure cultures were done using Luria Bertani hi-veg broth described above. 50 mL of the broth was prepared in 100 mL erlenmeyer flasks autoclaved then inoculated with the pure cultures. These were then incubated at 30 ± 2°C for 24 hours then used for soil amendments to test for the effects of glyphosate herbicide.
Assessment of the effects of glyphosate on bacteria Agar well method
A series of three tests were procedurally conducted with different concentrations of glyphosate herbicide to determine whether a zone of inhibition will be formed in a petri plate inoculated with the test organisms. A positive control was also kept using streptomycin antibiotic. First and second tests were done with nutrient agar media prepared in four different petri plates. Each plate was inoculated by 100 μL of the pure culture of Azotobacter species by streak plate method, 3 wells bored on the solid media then 50 μL and 100 μL of glyphosate 41% was added into two wells for first and second test respectively while 50 μL of streptomycin was added in the third well as control. These plates were incubated at 30 ± 2°C for 24 hours then observations made whether zone of inhibition was formed or not. The glyphosate used was the recommended field dose of 10 mL diluted with 1000 mL of water. The same procedure was followed for the third test but the glyphosate used without dilution i.e., 41% concentration [30].
Soil amendments method
100 g of soil sample was weighed into 3 different 250 mL erlenmeyer flasks and sterilized three times in three days by autoclaving at 120 psi for 15-20 minutes in order to kill the bacteria and other microorganisms present in the soil. Afterwards the soil was let to cool to room temperature then each flask was amended with the 24 hours old pure cultures of Azotobacter species. Flask one was amended with 1 mL of C1 of the pure culture and treated with 1 mL of glyphosate at field dose concentration (4.1 mg/mL) and marked as C1/FD (Colony 1/Field Dose). Flask two was amended with 1 mL of C2 of the pure culture and treated with 1 mL of glyphosate at double the field dose concentration (8.2 mg/mL) and marked as C2/DD (Colony 2/Double Dose). Flask three was amended with 1 mL of C3 of the pure culture and treated with 1 mL of glyphosate at triple the field dose concentration (12.3 mg/mL) and marked as C3/TD (Colony 2/Double Dose). Field dose was prepared by diluting 0.1 mL of 41% glyphosate in 10 mL water, while double dose prepared by diluting 0.2 mL of 41% glyphosate in 10 mL water and triple dose prepared by diluting 0.3 mL of 41% glyphosate in 10 mL water. Thereafter aliquots of these concentrations were taken and used for treatment of the soil samples in the three different flasks. A control flask was also set with only 100 g of the soil sample which was not sterilized and hence not amended with the bacteria neither was it treated with glyphosate. Moisture content of all these four flasks was adjusted to 60% and they were incubated at 30 ± 2°C for 14 days. Moisture content was maintained at 60% by adding sterilized distilled water after every two days. 1 g of the soil in each of the flasks was taken and used for serial dilution to identify the Colony Forming Units (CFUs) using nutrient agar after 1, 5, 10 and 14 days after incubation. After 24 hours of incubation, the colony forming units were counted and recorded down for each of the petri plates.
Results
Isolation of Azotobacter species from rhizosphere soil
Three pure cultures of Azotobacter species were successfully isolated from the soil. The bacteria were streaked on Ashby’s manitol agar. Based on the morphological characteristics these bacteria were identified as Azotobacter genus. The pure cultures (C1, C2, and C3) were grown in nutrient agar slants for further biochemical tests and characterization. After some days of observation older cells formed a cyst around the cells.
Morphological identification and biochemical characterization of Azotobacter species
Morphological identification
Based on morphology characterization, the appearance, shape and colour of the colonies was observed. C1 appeared orange to red, C2 appeared whitish, slimy, raised and glistering and C3 appeared grey to dark in colour.
These cultures were subjected to gram staining and all of them were gram negative rods to oval or coccoid in shape and occurred singly or in pairs or irregular clumps as was observed under high power oil immersion magnification (100x).
Biochemical characterization (Catalase test)
All the 3 colonies isolated were catalase positive and hence bubble or froth was produced when a drop of 3% hydrogen peroxide was added, a characteristic of Azotobacter genus confirming that the three colonies isolated were Azotobacter species.
Effects of glyphosate on bacteria
Agar well method
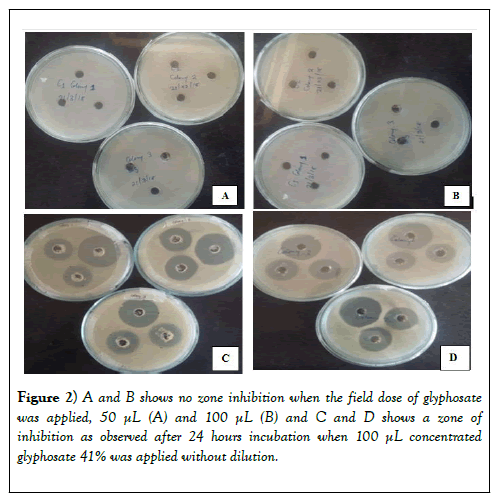
There was no zone of inhibition in the first and second tests while in the third test there was a clear zone of inhibition measuring on average 2.5 cm in diameter. The diameter of the zone of inhibition formed was measured and the results tabulated in Table 1. From the results, the growth of all the three colonies was inhibited when glyphosate 41% was added with an average diameter of the zone of inhibition above 2.5 cm (Figure 2).
| Sample | Hole 1 | Hole 2 | Average Diameter | Hole 3 (Control) |
|---|---|---|---|---|
| Colony 1 | 2.5 cm | 2.5 cm | 2.5 cm | 3.9 cm |
| Colony 2 | 2.9 cm | 2.8 cm | 2.85 cm | 3.6 cm |
| Colony 3 | 2.8 cm | 2.8 cm | 2.8 cm | 3.4 cm |
Table 1: Diameter of the zone of inhibition formed when glyphosate was added.
Soil amendments method
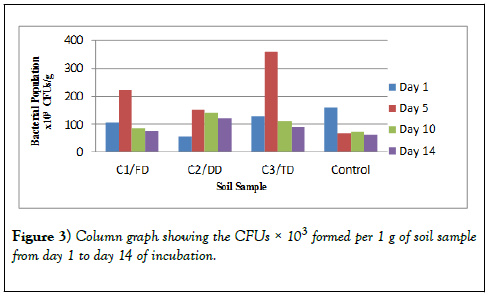
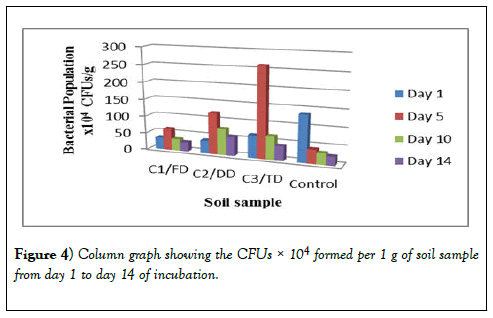
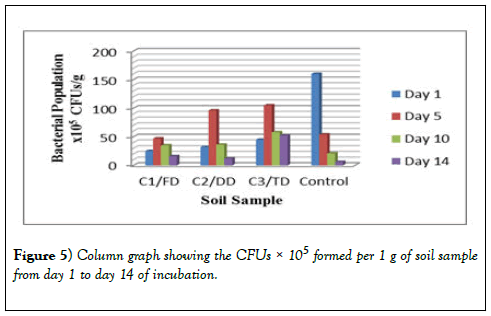
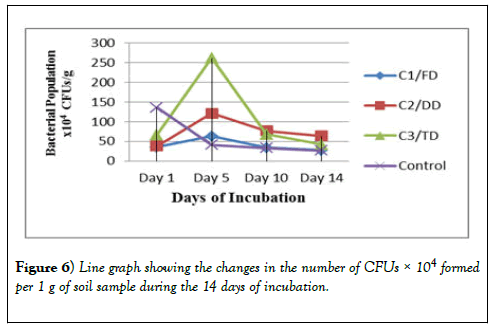
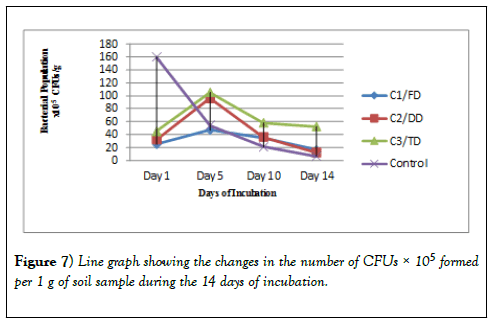
The bacterial growth observed after 24 hours of incubation were counted, recorded and tabulated in Table 2 for the 10-3 dilution, Table 3 for the 10-4 dilution and Table 4 for the 10-5 dilution. These results show that the CFUs for day 1 for all the three samples (C1/FD, C2/DD and C3/TD) are lower but after 5 days these CFUs increased drastically. After 10 days however, the number of CFUs started reducing and after 14 days of incubation the number of CFUs recorded was the lowest for all the three soil samples treated with glyphosate. However, for the control, the CFUs were higher on day 1 and continued to reduce exponentially as the days of incubation increased. The same trend was observed in other dilutions of 10-4 and 10-5 and therefore all these results obtained were the same.
| Soil Sample | Day 1 | Day 5 | Day 10 | Day 14 |
|---|---|---|---|---|
| C1/FD | 105 | 224 | 86 | 75 |
| C2/DD | 56 | 152 | 142 | 122 |
| C3/TD | 130 | 362 | 112 | 92 |
| Control | 160 | 68 | 74 | 64 |
Table 2: CFUs formed for the 14 days of incubation for 10-3 dilution.
| Soil Sample | Day 1 | Day 5 | Day 10 | Day 14 |
|---|---|---|---|---|
| C1/FD | 35 | 63 | 34 | 27 |
| C2/DD | 38 | 121 | 77 | 64 |
| C3/TD | 66 | 262 | 68 | 42 |
| Control | 136 | 41 | 33 | 26 |
Table 3: CFUs formed for the 14 days of incubation for 10-4 dilution.
| Soil Sample | Day 1 | Day 5 | Day 10 | Day 14 |
|---|---|---|---|---|
| C1/FD | 25 | 47 | 35 | 16 |
| C2/DD | 32 | 96 | 36 | 12 |
| C3/TD | 45 | 105 | 58 | 52 |
| Control | 160 | 54 | 21 | 6 |
Table 4: CFUs formed for the 14 days of incubation for 10-5 dilution.
From the graph in Figure 2 below, it was observed that one day after incubation of the soil, represented by the blue bar in the graph, recorded lower number of bacteria in all the three soil samples incubated. The number of bacteria however increased after 5 days of incubation as can be seen in the graph represented by the red bar while after ten days there was a drop in the number of bacteria as well as after fourteen days after incubation.
There was a difference in the number of CFUs between the control soil and the number of CFUs of the three samples. There was a difference in the trend as for the control there is an exponential decrease in the number of bacteria as the days of incubation increase. However, as the days go by, there is no significant difference in the number of bacteria at the end of the 14 days of study. In Table 2 and Table 3, the CFUs for control and that of the samples especially sample C1/FD the difference in the CFUs is insignificant after 14 days; 75 × 103 and 64 ×103 for C1/FD and control respectively and 27 × 104 and 26 × 104 for C1/FD and control respectively (Figures 3-6).
Discussion
Isolation of Azotobacter species from rhizosphere soilAll the bacteria isolated from the rhizosphere soil were of Azotobacter genus. These results were similar with those obtained by earlier researchers who isolated Azotobacter strains from the soil [31]. It is found out that the colors of bacteria are white and yellow, while the rounded shape and stem cells which concur with these findings [32].
Morphological identification of Azotobacter species
Beijerinck, the first microbiologist to describe Azotobacter species, found that Azotobacter species are gram negative rods while older cells may be coccoid and gram variable, and after him several researchers also found similar results through their studies [22,25,28,31,32]. It is found out that the gram reaction test showed that Azotobacter species are all gram negative [25,32].
Biochemical characterization (Catalase test)
The results show that Azotobacter species are catalase positive and this concur with the results of who carried out biochemical tests for Azotobacter strains isolated from rice field and found out that they were catalase positive [18,33,34]. It is described catalase as a common enzyme found in nearly all living organisms exposed to oxygen (such as bacteria, plants, and animals) [34]. It is a very important enzyme in protecting the cell from oxidative damage by reactive oxygen species by catalyzing the decomposition of hydrogen peroxide; a harmful byproduct of many normal metabolic processes; into less-reactive gaseous oxygen and water molecules to prevent damage to cells and tissues. The reaction which takes place is represented by the following equation:
2H2O2(l) → 2H2O(l) + O2(g)
The presence of catalase in a microbial or tissue sample can be demonstrated by adding hydrogen peroxide and observing the reaction. The production of oxygen can be seen by the formation of bubbles. This test, which can be seen with the naked eye, is possible because catalase has a very high specific activity, hence produces a detectable response, with the production of a gas.
Effects of glyphosate on bacteria
Agar well method
The findings showing the zone of inhibition are similar to those of who found out that there was a relationship between the concentration of glyphosate applied and the inhibition of the bacterial growth [5,16]. He noted that at lower concentrations there is little or no inhibition of bacterial growth but as the glyphosate concentration increases, inhibition of bacterial growth is clearly observed. Reference found contradictory results that Azotobacter species can withstand high concentrations of glyphosate of up to 5% of the herbicide without affecting their growth rate [33].
At field dose glyphosate does not inhibit the growth of Azotobacter bacteria even when the quantity applied is increased (second test) while at higher concentrations above the recommended field dose, glyphosate inhibit the growth of Azotobacter. The diameter of the zone of inhibition of above 2.5 cm means that at higher concentrations, glyphosate has a significant inhibition on the growth of Azotobacter bacteria due to intolerance. It was also noted that all the colonies are intolerant to higher concentrations of glyphosate.
Soil amendments method
The results from the graph in Figure 2 suggest that immediately after the application of glyphosate, it strongly binds to the soil hence not available to be broken down by the bacteria to be used as the source of nutrients particularly phosphate, carbon and nitrogen. However, five days after incubation, the glyphosate started dissociating from the soil hence available for breakdown by the bacteria as source of nutrients thereby an increase in the number of bacteria. The in vitro half-life of glyphosate ranges between 10-21 days; hence after 10 days of incubation the number of bacteria started dropping [10]. This can be attributed to the fact that most of the glyphosate that was available has been broken down and used by the bacteria hence reduced source of nutrients leading to the reduction in number. This follows that as the days of incubation increases, the number of bacteria also goes down and hence after fourteen days the number continued to reduce.
The findings of this study are in harmony with those of who found out that there was no shift in microbial community composition due to glyphosate exposure and further they noted that glyphosate is not directly toxic to bacteria but instead enhance growth efficiency [8]. It’s noted that when glyphosate is used as the single source of nitrogen, phosphorous and carbon, the population of the bacteria will increase and a continuous application will also significantly increase the number of the bacteria in the soil [33,35]. They however agreed that this positive effect has limits and concluded that at very higher concentrations of glyphosate there is an inhibitory effect. This agrees with the findings of this study which also found out that at elevated concentrations highly above the field dose there will be inhibition of the growth of Azotobacter species.
The difference in the number of CFUs between the control soil and the number of CFUs of the three samples presented in Table 2 and Table 3, for example indicate that the CFUs for control and that of the samples especially sample C1/FD the difference in the CFUs is insignificant after 14 days; 75 × 103 and 64 × 103 for C1/FD and control respectively and 27 × 104 and 26 × 104 for C1/FD and control respectively. This indicates that as the incubation days increase all the bacteria in the samples revert to depending on the natural source of nutrients for growth [33]. They noted that the bacterial population of soil treated with glyphosate was higher that the control soil without glyphosate herbicide and they added that the bacterial population between the three different soil samples was also varying as is the case of the findings of this study.
From the results in Figures 5 and 6 it can be observed that sample C3/TD recorded the highest number of bacteria as followed by C2/DD and sample C1/FD recording the lowest number of bacteria for the 14 days of incubation. This can be attributed to the fact that as the concentration of glyphosate in soil increases up to the optimal level; its breakdown also increases hence increased availability of nutrients for the bacteria which in turn leads to increased number of bacteria. This further explains the reason as to why glyphosate is having a growth enhancing effect on the soil bacteria hence positive effect up to the optimal level which can be tolerated by the bacteria. It is found out that the number of bacteria will increase with increase in the concentration of glyphosate applied up to certain high doses which has an inhibitory effect on the growth of the bacteria [36] (Figure 7).
Conclusion
The purpose of the study was to assess the effects of glyphosate herbicide on growth and number of Azotobacter species of bacteria when the herbicide is applied in the field to kill weeds and other unwanted plants that compete with crops for nutrients. Azotobacter strains were isolated from rhizosphere soil and identified based on morphological and biochemical characterization and thereafter used to assess the effects of glyphosate. In conclusion, the use of very higher concentrations of glyphosate in the field has net negative effects of inhibiting the growth of Azotobacter bacteria as was exhibited by the presence of zone of inhibition when glyphosate was applied without dilution i.e., 41% glyphosate. At field doses or slightly above field dose i.e., double or triple field dose, glyphosate use has positive effect of enhancing the growth of Azotobacter bacteria as was demonstrated by the soil amendments method used in the study. Further studies need to be done to ascertain the potential of Azotobacter species to degrade glyphosate laden soils, given the increase in number of the bacteria during the study, as a means of bioremediation to these soils.
REFERENCES
- Conway G. The doubly green revolution: Food for all in the twenty-first century. Cornell University Press, USA. 1998.
- Ratcliff AW, Busse MD, Shestak CJ. Changes in microbial community structure following herbicide (glyphosate) additions to forest soils. Applied Soil Ecology 2006;34:114-124.
- Abhilash PC, Singh N. Pesticide use and application: An Indian scenario. Journal of Hazardous Materials. 2009;165:1-2.
- Pesticides Industry Sales and Usage 2008 - 2012 Market Estimates. United States Environmental Protection Agency, 2017.
- Page WJ, Shivprasad S. Azotobacter salinestris sp. nov., a sodium-dependent, microaerophilic, and aero-adaptive nitrogen-fixing bacterium. International Journal of Systematic and Evolutionary Microbiology. 1991;41:369-376.
- Bohmont BL. The standard pesticide user's guide. Regents/Prentice Hall, USA. 1990.
- Franz JE, Mao MK, Sikorski JA. Glyphosate: A unique global herbicide. American Chemical Society. 1997;2:653.
- Woodburn AT. Glyphosate: Production, pricing and use worldwide. Pest Management Science: Formerly Pesticide Science. 2000;56:309-312.
- Glyphosate PubChem CID=3496. National Library of Medicine, National Center for Biotechnology Information, 2020.
- Miller A, Gervais JA, Luukinen B, et al. Glyphosate technical fact sheet. Oregon: Oregon State University Extension Services, USA, 2010.
- Duke SO, Rimando AM, Pace PF, et al. Isoflavone, glyphosate, and aminomethylphosphonic acid levels in seeds of glyphosate-treated, glyphosate-resistant soybean. Journal of Agricultural and Food Chemistry. 2003;51:340-344.
- Lu W, Li L, Chen M, et al. Genome-wide transcriptional responses of Escherichia coli to glyphosate, a potent inhibitor of the shikimate pathway enzyme 5-enolpyruvylshikimate-3-phosphate synthase. Molecular Biosystems. 2013;9:522-530.
- Haney RL, Senseman SA, Hons FM. Effect of roundup ultra on microbial activity and biomass from selected soils. Journal of Environmental Quality. 2002;31:730-735.
- Druille M, García-Parisi PA, Golluscio RA, et al. Repeated annual glyphosate applications may impair beneficial soil microorganisms in temperate grassland. Agriculture, Ecosystems & Environment. 2016;230:184-190.
- Rose MT, Cavagnaro TR, Scanlan CA, et al. Impact of herbicides on soil biology and function advances in agronomy. Advances in Agronomy 2015;136:133-220.
- Field E. The effects of glyphosate on the growth and viability of Azotobacter vinelandii. 2017.
- Martinez-Toledo MV, Gonzalez-Lopez J, De la Rubia T. Isolation and characterization of nitrogen-fixing bacteria in the soil. FEMS Microbiology Ecology 2013.
- Zablotowicz RM, Krutz LJ, Reddy KN, et al. Rapid development of enhanced atrazine degradation in a Dundee silt loam soil under continuous corn and in rotation with cotton. Journal of Agricultural and Food Chemistry. 2007;55:852-859.
- Zhang J, Kaeseberg T, Krebs P, et al. Comments on" Heavy metals and polycyclic aromatic hydrocarbons: Pollution and ecological risk assessment in street dust of Tehran". Journal of Hazardous Materials. 2014;273:124-126.
- Radcliffe JC. Pesticide use in Australia. Australian Academy of Technological Sciences and Engineering. 2002.
- Becking JH. The family azotobacteraceae. InThe Prokaryotes Springer, New York, NY, USA, 1992;2:3144-3170.
- Tilak KV, Ranganayaki N, Pal KK, et al. Diversity of plant growth and soil health supporting bacteria. Current Science. 2005;89:136-150.
- Khan MS, Zaidi A, Wani PA, et al. Role of plant growth promoting rhizobacteria in the remediation of metal contaminated soils. Environmental Chemistry Letters. 2009;7:1-19.
- Mirzakhani M, Ardakani MR, Band AA, et al. Response of spring safflower to co-inoculation with Azotobacter chroococum and Glomus intraradices under different levels of nitrogen and phosphorus. American Journal of Agricultural and Biological Sciences. 2009;4:255-261.
- Tejera NL, Lluch C, Martinez-Toledo MV, et al. Isolation and characterization of Azotobacter and Azospirillum strains from the sugarcane rhizosphere. Plant and Soil. 2005;270:223-232.
- Garg SK, Bhatnagar A, Kalla A, et al. In vitro nitrogen fixation, phosphate solubilization, survival and nutrient release by Azotobacter strains in an aquatic system. Bioresource Technology. 2001;80:101-109.
- Onyeze RC, Onah GT, Igbonekwu CC. Isolation and characterization of Nitrogen-fixing bacteria in the soil. International Journal of Life Science and Pharma Research 2013;2.
- Chennappa G, Sreenivasa MY, Nagaraja H. Azotobacter salinestris: A novel pesticide-degrading and prominent biocontrol PGPR bacteria. InMicroorganisms for Green Revolution. 2018;2:23-43.
- Deshmukh AM. Handbook of media, stains and reagents in microbiology. Oxford Book Company, USA, 2007.
- Vos P, Garrity G, Jones D, et al. Bergey's manual of systematic bacteriology: Volume 3: The Firmicutes. 2011.
- Chennappa G, Adkar-Purushothama CR, Suraj U, et al. Pesticide tolerant Azotobacter isolates from paddy growing areas of northern Karnataka, India. World Journal of Microbiology and Biotechnology. 2014;30:1-7.
- Rahmi P, Baharudin M, Nasaruddin M, et al. Morphological characteristics and ability isolate of Azotobacter sp. to produce IAA origin from cocoa rhizosphere. International Journal of Current Microbiology and Applied Sciences. 2015;4:593-598.
- Partoazar M, Hoodaji M, Tahmourespour A. The effect of glyphosate application on soil microbial activities in agricultural land. African Journal of Biotechnology. 2011;10:19419-19424.
- Chelikani P, Fita I, Loewen PC. Diversity of structures and properties among catalases. Cellular and Molecular Life Sciences (CMLS). 2004;61:192-208.
- Araújo AD, Monteiro RT, Abarkeli RB. Effect of glyphosate on the microbial activity of two Brazilian soils. Chemosphere. 2003;52:799-804.
- Gomez E, Ferreras L, Lovotti L, et al. Impact of glyphosate application on microbial biomass and metabolic activity in a Vertic Argiudoll from Argentina. European Journal of Soil Biology. 2009;45:163-167.


