Essentials in brain connectivity
Received: 04-Sep-2017 Accepted Date: Oct 14, 2017; Published: 20-Oct-2017
Citation: Mutihac R. Essentials in brain connectivity. J Neurol Clin Neurosci. 2017;1(1):09-15.
This open-access article is distributed under the terms of the Creative Commons Attribution Non-Commercial License (CC BY-NC) (http://creativecommons.org/licenses/by-nc/4.0/), which permits reuse, distribution and reproduction of the article, provided that the original work is properly cited and the reuse is restricted to noncommercial purposes. For commercial reuse, contact reprints@pulsus.com
Abstract
Imaging Neuroscience is aiming to reveal functional changes, that is, changes in brain activity, and structural changes, which address changes in neuroanatomy. There is a growing interest in defining functional interactions of different brain regions based on the increased sensitivity and specificity of functional magnetic resonance imaging (fMRI). The present contribution is a brief overview of the trends in brain connectivity research driven by the development of several techniques derived from fMRI.
Introduction
Resting-state functional magnetic resonance imaging (rsfMRI) has increasingly spread in functional brain imaging research as means to evaluate regional interactions that occur when a subject in the scanner is not performing an explicit task (no activity). Structurally segregated and functionally specialized regions of the human cerebral cortex are interconnected by a dense network of cortico-cortical axonal pathways [1]. By using diffusion spectrum imaging (DSI), these pathways were noninvasively mapped within and across cortical hemispheres in humans. An analysis of the resulting large-scale structural brain networks reveals a structural core within posterior medial and parietal cerebral cortex, as well as several distinct temporal and frontal modules. Brain regions within the structural core constitute connector hubs that link all major structural modules. The spatial and topological centrality of the core within cortex suggests an important role in functional integration [2].
The human brain is a highly complex organ forming the center of the human nervous system. It has a left hemisphere and a right hemisphere covered by a layer of nerve tissue called the cerebrum (cerebral cortex). The normal human brain has been estimated to contain about 1011 to 1012 neurons of which about 1010 are cortical pyramidal cells. These cells pass signals to each other via approximately 1015 synaptic connections. The adult human brain weighs on average about 1.5 kg with a size of around 1130 cm3 in women and 1260 cm3 in men, although there is substantial individual variation.
The interest in functional brain studies lays in the electrical activity of ring neurons, which cannot entirely be inferred by analyzing the vascular process because:
• The hemodynamic lag varies in a complex way from tissue to tissue,
• No theory on the relationship between the electrical and hemodynamic processes is available.
Yet the vascular process provides valuable information on the electrical activity in ring neurons, which advocates for the attention, paid to fMRI data analysis and need for methods that circumvent some of the pitfalls associated with the detection of the blood oxygenation level dependent (BOLD) image contrast. The presence of artifacts (e.g., subject and scanner movements, RF coil heating, differences from scanner to scanner...), and physiological sources of variability (cardiac, pulmonary, and other pulsations) render detection of the activation-related signal changes di cult and sometimes questionable. An additional difficulty in delineating functional correlates from spatiotemporal fMRI data sets stems from the relatively small effect sizes in blood flow related phenomena, which is translated in low image contrast-to-noise ratio (CNR) of the BOLD signal. The difficulty in extracting information from raw data is supplementary increased by the functional correlates of brain activity that may relate to behavioral paradigms in complicated ways.
Functional Brain Imaging
Functional MRI (fMRI), a non-invasive functional neuroimaging modality, has rapidly become a common tool for mapping the working brain activation patterns, both in health and in disease [3]. It has underwent a fast growing and remaining during the last decades and, as an intrinsically multi-disciplinary approach, fMRI has gradually been involved in a large spectrum of scientific disciplines comprising neuroscience, medical physics, psychology, political science, economics, and law (to quote just major fields). In parallel, new techniques have emerged in data acquisition and analysis, experimental design, image reconstruction and enhancement, leading to more accurate results and deeper insights.
The index of neuronal activity (contrast) quite spread in neuroimaging is the blood oxygenation level dependent (BOLD) signal [4], which is based on the differing magnetic susceptibilities of the oxygenated hemoglobin (diamagnetic) and deoxygenated hemoglobin (paramagnetic) in relation with the sur-rounding tissue. The basic assumption is that an increase in neuronal activity within a brain region entails an increase in local blood flow, leading to reduced concentrations of deoxyhemoglobin in the blood vessels. Consequently, relative decreases in deoxyhemoglobin concentration attract a reduction in local field inhomogeneity and a slower decay of the MR signal, resulting in higher intensities in T2* weighted (functional) images [5].
The BOLD contrast indirectly probes neuronal activity changes via evoked cerebral blood flow (CBF), cerebral blood volume (CBV) and cerebral metabolic rate of oxygen (CMR02) changes. By all means, the spatial specificity to neuronal activation is limited. In addition, the non-linear interaction of CBF, CBV and CMR02 may adversely affect quantitative interpretations of the BOLD signal across cortical depths with different baseline physiology [6]. Measuring these non-BOLD physiologically welldefined contrasts with particular emphasis on arterial spin labeling (ASL), vascular space occupancy (VASO) and calibrated fMRI, directly on a depthdependent level has the potential to alleviate these shortcomings. Such non- BOLD fMRI methods are promising alternatives compared to conventional fMRI as they are able to provide improved spatial specificity, quantifiability and, hence, physiological interpretability as a function of cortical depth [6].
Any changes in blood flow and oxygenation (vascular and hemodynamic) are temporally delayed relative to the neural ring, a confounding factor known as hemodynamic lag. It corresponds to gross aberrancy in functional connectivity (FC) measures, performance deficits in multiple domains, and local and global perfusion deficits. Correction of lag partially normalizes abnormalities in measured FC. In some cases like stroke, rsfMRI can reliably identify areas of hemodynamic delay [7].
In terms of the experimental paradigm, fMRI data analysis can be loosely divided into two categories. Task-related fMRI data are acquired while the subject is performing a sequence of timed conditions, either in block design experiments (where the conditions of certain duration alternate with periods of rest), or in event-related (ER) experiments (which rely on a random sequence of conditions represented by single time points). Taskrelated fMRI data analysis is routinely carried out by means of the general linear model (GLM) within the framework of statistical parametric mapping (SPM) [8]. Resting-state fMRI data are collected without any experimental task while the subject does not perform any intentional activity. The central goal is to investigate the intrinsic brain network structure by observing the spontaneous low frequency fluctuations of the BOLD fMRI signal. As such, new insights were allowed leading to resting-state networks (RSNs), default mode network (DMN) [9], a comprehensive cortical parcellation [10], and the network characteristic relationship to behavioral parameters.
There are several methodologies to analyze functional neuroimaging data.
• Univariate/multivariate. The univariate approach probes individual voxels in the imaging data for a relationship to the experiment condition, commonly implemented by the GLM. The multivariate approach, also referred to as multi-voxel pattern analysis or multivariate pattern analysis, probes data for global and potentially distributed responses to an experimental condition. Mathematical techniques involved: support vector machines (SVM) to study responses to visual stimuli [11], pattern recognition (PR) algorithms like random forest based gini contrast [12], sparse regression and dictionary learning [13], and so forth.
• Confirmatory/exploratory Most of imaging neuroscience relies on conrfirmatory analysis like hypothesis-led inference, which makes use of spatially extended processes such as SPM [8]. Changes are specified as regressors of interest in a multiple linear regression framework like the GLM and the estimated regression coefficients are tested against a null hypothesis (e.g., no activity). The voxel-wise test statistics form summary images known as statistical parametric maps, which are commonly assessed for statistical significance or tested for the size or mass of suprashresholded clusters [14]. The resulting map of statistic is a representation of the spatial distribution of functional activity elicited by the task in question. Contrarily to confirmatory analysis, model-free exploratory analysis describes the decomposition of observed data into a set of temporal and spatial components according to some criteria like maximal variance (PCA) or statistical independence (ICA) [15] with no need of a prior model. Even if the basic assumptions of running the above algorithms loosely hold, the analysis will come out with a subspace of estimated components that must be validated in some way. This issue can be handled in several ways, but we advocate to pair spatial ICA and temporal fuzzy cluster analysis (FCA) [16], and, above all, statistical resampling (shuffling) of experimental data [17]. These methods are based on fundamentally different concepts and mechanisms enforcing complementarity.
• Functional connectivity analysis. FC analysis addresses the intrinsic brain network structure along with the inter-region interactions. Most of these studies deal with resting state data to parcelate the brain [10] or looking for correlates to behavior [18]. Task specific data can be used to study causal relationships among brain regions like dynamic causal mapping (DCM) [19].
In any case, the interpretation of functional brain imaging data inevitably requires some assumptions on processing in the working brain that may not be entirely realistic and which preclude canonical methods of data analysis and experimental design. Two general principles of cerebral function have been derived from investigating brain lesions and recording signals from smaller or larger clusters of neurons:
• Functional specialization of brain regions, which means that different brain regions perform different tasks [20].
• Functional integration [21], which states that cerebral functions are carried out by networks of interacting regions and that different functions correspond to different networks.
As such, there are two main types of assumption underlying the interpretation of functional neuroimages, namely, the subtraction paradigm and the covariance paradigm [22]. The subtraction paradigms assume that different brain regions are engaged in different brain functions (i.e., they rely on functional specialization). The covariance paradigms assess the temporal covariance between different brain regions during a particular task. Significant covariance between regions associated with a particular brain function is termed functional connectivity. The extraction of functional correlates from raw data sets is facilitated by using the subtraction or covariance paradigms during preprocessing step. Due to their complementarity, it is often necessary to employ both paradigm types in order to resolve all the functional components of a given cerebral process [23].
Resting-State Functional Brain Imaging
Analyses of task-free rsfMRI have revealed the existence of temporally correlated spontaneous low-frequency (0:001 0:100 Hz) fluctuations of BOLD signal of widely spatially separated brain regions [24,25]. Seedbased and data-driven approaches are commonly used to identify brain regions that share a common time course of spontaneous fluctuations. Such temporal correlations are presumed to reflect intrinsic FC and have been demonstrated across several distinct networks serving critical functions like vision, hearing, language, and salience detection [26-28].
The dynamical integration among brain regions, which demonstrates neuronal communications beyond the underlying anatomical structure, is currently studied by functional and effective connectivity [29]. Functional connectivity (FC) measures statistical dependencies of time-series between distinct units; while effective connectivity (EC) investigates the influence one neuronal system exerts over another, by means of predictive models [30]. The former has been comprehensively described and integrated in the functional connectome of the human brain [31].
Resting-state networks
Modern cognitive neuroscience provided evidence that our brain is never at rest. Brain’s energy is significantly used up at rest by spontaneous neuronal activity (20%), while task-related increases in metabolism energy are minor (<5%). It comes out that during wakeful periods of overall deliberate inactivity and inattention to external stimuli; several distinct cortical brain regions are still active. These parts of the brain are functionally linked forming restingstate networks (RSNs), which reflect the underlying structural connectivity architecture of the human brain. Motor, visual, auditory networks and networks connected with language, working memory and attention were identified as RSNs. The complexity of functional connectivity supports the existence of direct neuroanatomical connections (i.e., white matter tracts) among the functionally linked brain regions, which contribute to the ongoing neuronal communication and information transfer [18].
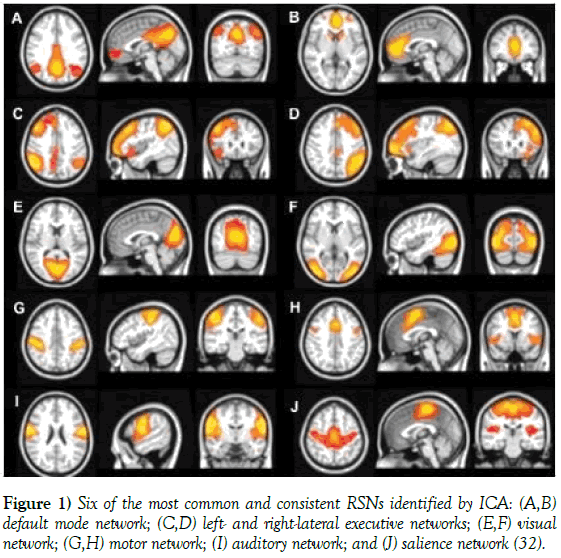
Though not a consensus on the number, nature, and the exact role of the RSNs exists, there were identified six main consistent RSNs [32,33] by means of ICA of fMRI data (Figure 1) employed in several studies. RSN 1 is the DMN, which typically comprises bilateral inferior parietal lobe (IPL), bilateral superior frontal gyrus, the posterior cingulate cortex/precuneus (PCC), and medial prefrontal cortex (mPFC). RSN 2 is a network of dorsal attention, which includes bilateral intraparietal sulcus/cortex at the intersection of the precentral and superior frontal sulcus, ventral precentral, and middle frontal gyrus. RSN 3 is a posterior visual processing network, which involves the retinotopic occipital cortex and temporal-occipital regions. RSN 4 is the sensory-motor network including the precentral, postcentral, and medial frontal gyri, the primary sensory-motor cortices, and the supplementary motor area. RSN 5 primarily involves the bilateral superior temporal cortex, and is the auditoryphonological network. RSN 6 is a network related to self-referential mental 7 activity, which includes the medial-ventral prefrontal cortex, the pregenual anterior cingulate, the hypothalamus, and the cerebellum. Among all the resting state patterns, the default mode is the most prominent, and was originally discovered in resting metabolism positron emission tomography (PET) data [33]. Later on, it was assumed to reflect an organized, baseline default mode of brain function.
Figure 1: Six of the most common and consistent RSNs identified by ICA: (A,B) default mode network; (C,D) left- and right-lateral executive networks; (E,F) visual network; (G,H) motor network; (I) auditory network; and (J) salience network [32].
The BOLD signal fluctuations associated with each network were correlated with the EEG power variations of delta, theta, alpha, beta, and gamma brain rhythms. Each functional network was characterized by a specific electrophysiological signature that involved the combination of different brain rhythms. Moreover, the fused EEG/fMRI analysis permitted a finer physiological fractionation of brain networks in the resting human brain. The result supports the coalescence of several brain rhythms within largescale brain networks as suggested by biophysical studies [32].
Despite the growing number of resting-state functional connectivity MRI (fcMRI) studies, critical concerns regarding the underlying source of the BOLD signal correlations have still persisted.
Default mode network
Information processing in brain is based on the complementary principles of modular and distributed information processing. The former emphasizes the specialization of functions within different brain areas. The latter emphasizes the massively parallel nature of brain networks and the fact that function also emerges from the flow of information between brain regions [34]. Brain regions simultaneously activated during any cognitive process are functionally connected, forming large-scale networks. These functional networks can be examined during active conditions (ER fMRI) and also in passive states (rsfMRI). During rest, small but consistent increases in activity occur in a specific subset of regions from the RSNs called the default mode network (DMN), which is the most widely investigated brain network.
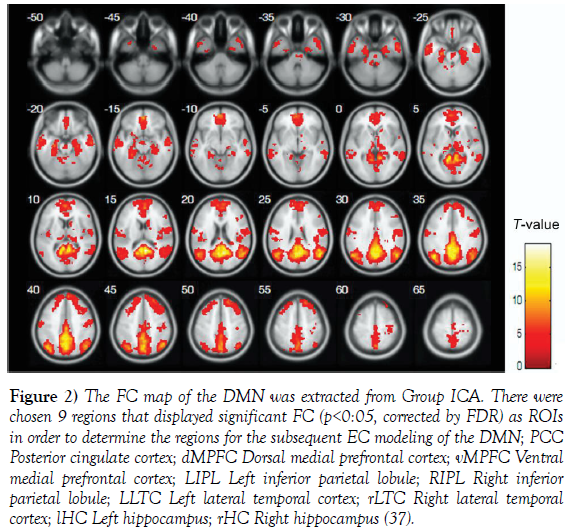
The DMN consists of a set of brain regions that typically deactivate during performance of cognitive tasks [33]. The DMN is detectable using task-free fcMRI and is implicated in episodic memory processing [35,36]. The DMN regions are involved in performing different tasks, such as introspection and spontaneous cognition, memory retrieval, emotional process, and social cognition. It is also known the role of DMN in the shift between resting and focused attention processing and it is believed that DMN is closely related to the function of consciousness. Yet the functions of each node within the DMN are still not clearly understood (Figure 2).
Figure 2: The FC map of the DMN was extracted from Group ICA. There were chosen 9 regions that displayed significant FC (p<0:05, corrected by FDR) as ROIs in order to determine the regions for the subsequent EC modeling of the DMN; PCC Posterior cingulate cortex; dMPFC Dorsal medial prefrontal cortex; vMPFC Ventral medial prefrontal cortex; LIPL Left inferior parietal lobule; RIPL Right inferior parietal lobule; LLTC Left lateral temporal cortex; rLTC Right lateral temporal cortex; lHC Left hippocampus; rHC Right hippocampus [37].
Diffusion Magnetic Resonance Imaging
Diffusion MRI (dMRI) has emerged in 1985 as an approach to produce images of the molecular diffusion process in tissues. Diffusion-weighted MRI (DWI or DW-MRI) is an imaging modality that uses the diffusion of water molecules to generate contrast in MR images [38]. Diffusion is measured by applying a gradient pulse to a magnetic field along a particular direction. A set of uniformly distributed gradient directions is typically employed to generate a set of diffusion weighted volumes. An unweighted volume is additionally acquired under the same magnetic field with no gradient pulse applied.
Two main computational aims stand behind the interest in DWI:
• Study of the local tissue properties like diffusivity
• Estimation of the local directions and global pathways of diffusion.
In DWI, the intensity of each image element (voxel) reflects the best estimate of the rate of water diffusion at that location. Because the mobility of water is driven by thermal agitation and highly dependent on its cellular environment, the hypothesis behind DWI is that findings may indicate (early) pathologic change. Major clinical applications of DWI are in the study and treatment of neurological disorders.
Diffusion tensor imaging
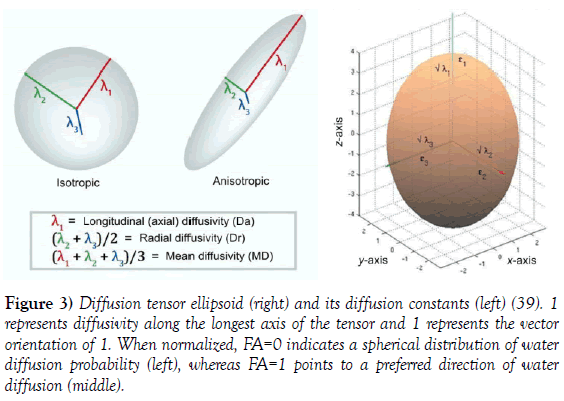
The underlying physical process of diffusion impinges a group of water molecules to move out from a central point, and gradually reach the surface of an ellipsoid for an anisotropic medium or sphere for an isotropic medium. The ellipsoid formalism plays also the role of a mathematical method of organizing tensor data [39] (Figure 3).
Figure 3: Diffusion tensor ellipsoid (right) and its diffusion constants (left) [39]. 1 represents diffusivity along the longest axis of the tensor and 1 represents the vector orientation of 1. When normalized, FA=0 indicates a spherical distribution of water diffusion probability (left), whereas FA=1 points to a preferred direction of water diffusion (middle).
Diffusion tensor imaging (DTI) makes use of eigenvalues and eigenvectors of the water diffusion tensor to generate images. The diffusion tensor [40], is a 3 3 symmetric positive-definite matrix and is proportional to the co-variance matrix of a normally distributed local diffusion pro le, so that the dominant eigenvector of this tensor is the principal direction of local diffusion. Since the volume contains contiguous tissue fibers, the volume of diffusion tensors is estimated by setting regularity conditions on the underlying field of tensors [41]. In fibrous tissues like white matter (WM), water diffusion is relatively unimpeded along the fiber orientation. In contrast, water diffusion is highly restricted in all orthogonal directions to the fibers, so that the diffusion in fibrous tissues results anisotropic.
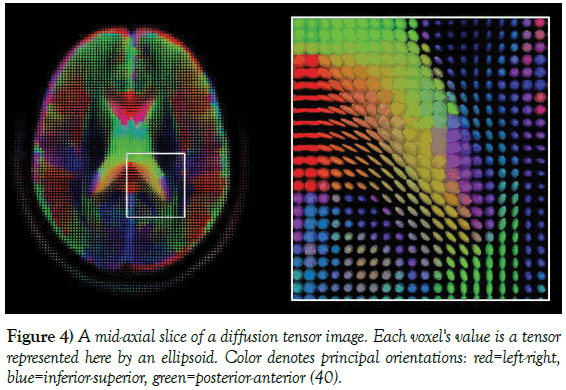
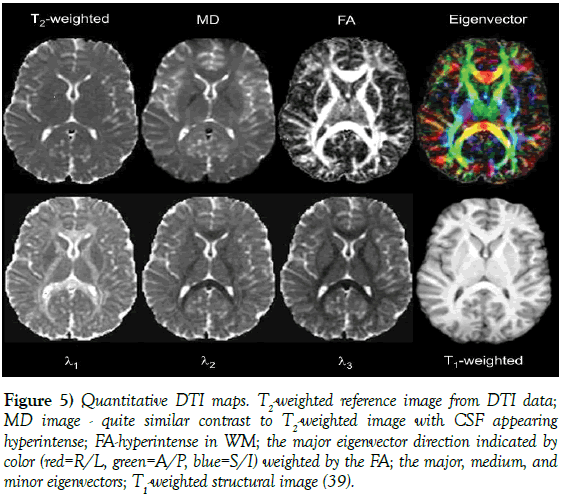
Common DTI comprises FA maps, principal diffusion direction maps, and fiber tracking maps. In practice, DTI measures are mean diffusivity (MD), fractional anisotropy (FA), radial diffusivity (Dr) and axial diffusivity (Da). Such scalar values can be extracted from the diffusion tensor, which indirectly measure tissue properties such as the demyelination of axonal fibers [42], or the presence of edema [43]. FA is a scalar value that measures the grade of spherical probability of diffusion of a molecule (i.e., degree of anisotropy) in the medium. FA is highly sensitive to microstructural changes, but not very specific to the type of changes (e.g., radial or axial) [39]. In addition, FA is a measure often used indiffusion imaging where it is thought to reflect fiber density, axonal diameter, and myelinationinWM. In clinical neurology, various brain pathologies may be best detected by inspection of particular measures of anisotropy and diffusivity. FA identifies any temporary functional variations in a structured volume of WM (Figure 4).
Conventional MRI reveals tumors, brain bleeding, strokes, multiple sclerosis lesions, and damage to the blood-brain barrier, but not any dam-age to axons. Diffusion tensor MRI can reveal that the myelin coating of some axons has been disrupted, which impairs their ability to transmit signals, or that some axons have been sheared away from their normal connections. The power of DTI resides in its sensitivity to microstructural axonal injury, a pathological condition that presumably contributes to persistent cognitive and behavioral impairments in some multiple neurological disorders, such as schizophrenia [44], Alzheimer’s disease [45,46], epilepsy [47,48], and autism [49,50]. Likewise, DTI has widely been employed to map WM anatomy prior to surgery [51]. As such, localization of critical WM pathways in clinical interventions is carried out minimizing damages to these areas. Visualization of these pathways is performed by means of the eigenvector maps (Figure 5).
Figure 5: Quantitative DTI maps. T2-weighted reference image from DTI data; MD image - quite similar contrast to T2-weighted image with CSF appearing hyperintense; FA-hyperintense in WM; the major eigenvector direction indicated by color (red=R/L, green=A/P, blue=S/I) weighted by the FA; the major, medium, and minor eigenvectors; T1-weighted structural image [39].
Fiber tractography
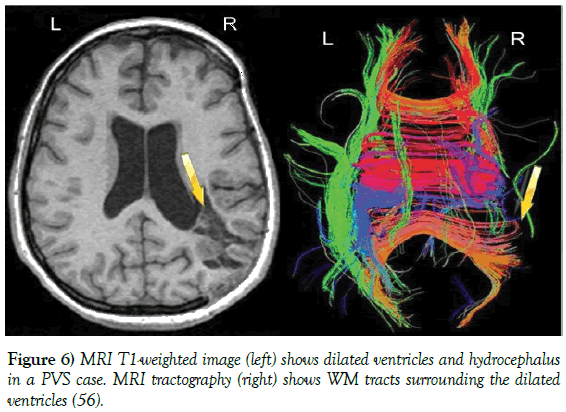
If the principal direction of diffusion at each voxel in the volume is known, it is possible to estimate the global pathways of diffusion through a process called tractography [52]. MR tractography based on DTI has emerged about two decades ago. At the beginning, it was successfully applied to some neurological conditions and most commonly involved in preoperative planning for brain tumors and vascular malformations. Nowadays, areas of active research include stroke and dementia, since it may come out with valuable in-formation not available by means of other imaging modalities. This technique was initially introduced using the deterministic streamline algorithm and has evolved to use more sophisticated probabilistic approaches [53]. DTI tractography, or fiber tractography (FT), consists in a 3D modeling (reconstruction) technique used to visually display neural tracts through data acquired by DTI [54]. It employs special methods of MRI and computerbased image analysis. The results are rendered in 2D and/or 3D images. DTI tractography is commonly used to reconstruct WM structures and assess structural connectivity in vivo (Figure 6) [55].
Figure 6: MRI T1-weighted image (left) shows dilated ventricles and hydrocephalus in a PVS case. MRI tractography (right) shows WM tracts surrounding the dilated ventricles [56].
Diffusion spectrum imaging
The main pitfalls in DTI are the following;
• the tractography algorithms may fail because of the disruption of voxel to voxel continuity caused by WM damage
• DTI has limited capacity to resolve the direction of individual fiber tracts at junctions between overlapping bundles.
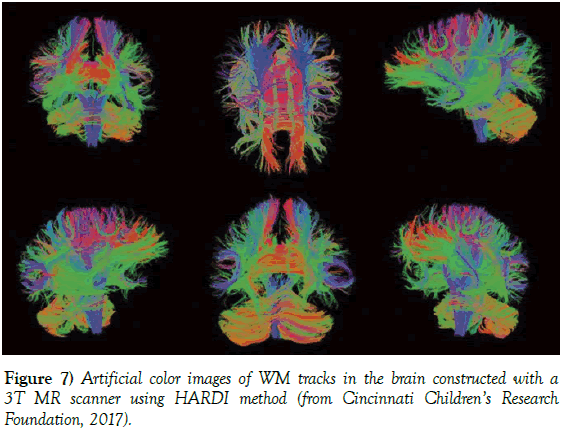
Due to the relatively low resolution of diffusion MRI, many diffusion pathways may cross, kiss or fan at a single location. As such, the single principal direction of the diffusion tensor is not an appropriate model for the local diffusion distribution in all cases. This issue is commonly overcome by estimating multiple directions of local diffusion using more complex models, which include mixtures of diffusion tensors [57], diffusion spectrum imaging (DSI) [58], and fiber orientation distribution functions [59]. These approaches commonly involve high angula resolution diffusion imaging (HARDI) acquisition with a large number of gradient directions [60]. In particular, HARDI successfully overcomes the bercrossing issue (Figure 7) [61].
Figure 7: Artificial color images of WM tracks in the brain constructed with a 3T MR scanner using HARDI method (from Cincinnati Children’s Research Foundation, 2017).
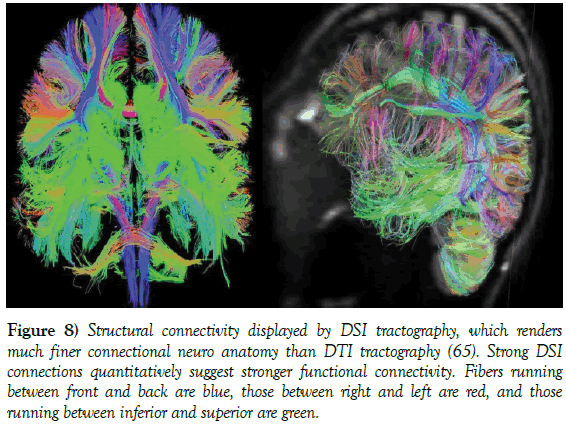
Diffusion spectrum imaging (DSI) is a version of DWI that is sensitive to intravoxel heterogeneities in diffusion directions caused by crossing fiber tracts and thus allowing more accurate mapping of the axonal trajectories than other diffusion imaging approaches [62]. DSI is a technique characterized by the acquisition of a very large number of images applying strong motion sensitizing magnetic gradients in multiple directions [63]. DSI is mapping complex tissue fiber architectures by imaging the 3D spectra of tissue water diffusion [64]. DSI tractography has the capacity to image crossing fibers in neural tissue, which is essential to non-invasively image the connectional neuro anatomy [62].
To generate diffusion images, the brain is scanned, pretty much the way a patient undergoes a medical MRI. Data collected during the scan are subsequently analyzed using specialized algorithms to produce diffusion spectrum images. Each fiber in the image represents hundreds to thousands of individual neural fibers in the brain (Figure 8).
Figure 8: Structural connectivity displayed by DSI tractography, which renders much finer connectional neuro anatomy than DTI tractography [65]. Strong DSI connections quantitatively suggest stronger functional connectivity. Fibers running between front and back are blue, those between right and left are red, and those running between inferior and superior are green.
Connectomics
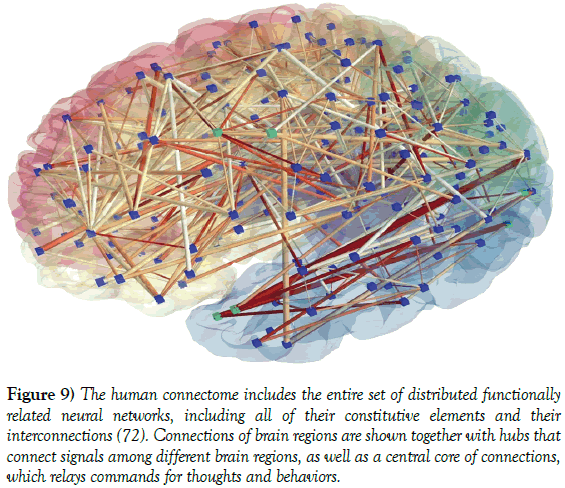
The term connectome firstly coined by Sporns and co-workers [66] in 2005 refers to the mapping of connectivity all over the brain by means of imaging modalities like rsfMRI and dMRI (Figure 9). In rsfMRI experiments performed to investigate brain connectivity, fMRI data are acquired from a subject at rest in the scanner hypothesizing that the spontaneous time series from functionally related brain regions must be correlated [67-70]. Since all major functional networks in the brain spontaneously fluctuate at very low frequency in their specific range, appropriately qualitative and quantitative rsfMRI data allow mapping the FC [71] (Figure 9).
Figure 9: The human connectome includes the entire set of distributed functionally related neural networks, including all of their constitutive elements and their interconnections [72]. Connections of brain regions are shown together with hubs that connect signals among different brain regions, as well as a central core of connections, which relays commands for thoughts and behaviors.
The simplest analysis methods, based on the correlation strength be-tween the time courses of any two brain regions, though not quantitative, permit to infer whether the regions are functionally connected. More complex and, particularly, multivariate analysis methods such as independent component analysis (ICA) [16,73,74] allow, from a single data-driven analysis, the simultaneous estimation of multiple distinct components, with control over the level of component sub-splitting [75]. It is worth noting that none of these methods reveal whether connectivity is direct or indirect [76]. Yet a unanimous agreement exists that a major problem for rsfMRI-based network modeling as well as for graph theory arises if inferences rely on the assumption that the correlation between the time courses of two nodes is unambiguously indicating a direct or indirect connection [75].
Concluding Remarks
Recent advances in fMRI and DTI have provided tools to view the human brain connectome by assessing tract structure, ber connectivity, and functional connectivity. Cortical and white matter damage arising in brain injury can disrupt structural connectivity, thereby affecting patterns of functional brain activity and connectivity. DTI allows to investigate WM damage and to assist in understanding pathological changes in the structural connectivity. DSI can display brain’s major neuron pathways supporting neurologists relate structure to function. On the other hand, rsfMRI permits to assess large-scale functional connectivity and integrity of neuronal networks. All fMRI-based methods providing functional and structural connectivity measures may foster the development of imaging biomarkers of cognitive and neurobehavioral impairments.
REFERENCES
- Greicius MD, Supekar K, Menon V, et al. Resting-state functional connectivity re ects structural connectivity in the default mode network. Cereb Cortex. 2009;19:72-8.
- Hagmann P, Cammoun L, Gigandet X, et al. Mapping the structural core of human cere-bral cortex. PLOS Biology. 2008;6:e159.
- Buxton B. Introduction to Functional Magnetic Resonance Imaging. Cambridge University Press. 2009.
- Ogawa S, Lee TM, Nayak AS, et al. Oxygenation-sensitive contrast in magnetic resonance image of rodent brain at high magnetic elds. Magnetic Resonance in Medicine. 1990;14:68-78.
- Spinu S, Enciu LE, Mutihac R. Con rmatory versus xploratory sta-tistical analysis of functional brain imaging data. Rom J Phys 2016;61:1299-311.
- Huber L, Uludag K, Moller HE. Non-BOLD contrast for laminar fMRI in humans: CBF, CBV, and CMR02. Neuro Image. 2017.
- Siegel JS, Snyder AZ, Ramsey L, et al. The effects of hemodynamic lag on functional connectivity and behavior after stroke. J Cerebral Blood Flow & Metabolism. 2015;36:2162-76.
- Friston K, Holmes A, Worsley K, et al. Statistical parametric maps in functional imaging: a general linear approach. Hum Brain Mapp. 1995;24:189-210.
- Buckner RL, Andrews-Hanna JR, Schacter DL. The brain's default network: anatomy, function, and relevance to disease. Ann N Y Acad Sci. 2008;1124:1-38.
- Yeo BTT, Krienen FM, Sepulcre J, et al. The organization of the human cerebral cortex estimated by intrinsic functional connectivity. J Neurophysiol. 2011;106(3):1125-65.
- Haxby JV, Gobbini MI, Furey ML, et al. Distributed and overlapping representations of faces and objects in ventral temporal cortex. Science. 2001;293(5539):2425-30.
- Langs G, Menze BH, Lashkari D, et al. Detecting stable distributed patterns of brain activation using Gini contrast. NeuroImage. 2011;56(2):497-507.
- Varoquaux G, Gramfort A, Pedregosa F, et al. Multi-subject dictionary learning to segment an atlas of brain spontaneous activity. Inf Process Med Imaging. 2011;22: 562-73.
- Poline JB, Worsley KJ, Evans AC, et al. Textit Combining spatial extent and peak intensity to test for activations in functional imaging. NeuroImage. 1997;5;83-96.
- Mutihac R, Van Hulle MM. Comparison of principal component analysis and independent component analysis for blind source separation. Rom Rep Phys. 2004;56(1):25-37.
- Mutihac R. Validating independent component analysis of functional brain imaging data by temporal cluster analysis. NeuroImage. 2009;47:S123.
- Mutihac R, et al. CA decomposition of functional brain imaging data Statistical assessment by resampling. Neuroimage Modeling & Analysis, Mul-tivariate Modelling, PCA & ICA. 2007;36:S125.
- van den Heuvel MP, Stam CJ, Kahn RS, et al. Efficiency of functional brain networks and intellectual performance. J Neurosci. 2009;29(23):7619-24.
- Friston K. Dynamic causal modeling. NeuroImage. 2003;19(4):1273-302.
- Zeki S. Functional specialization in the visual cortex: the generation of separate constructs and their multistage integration. Signal and Sense. 1990;85-130.
- Gernstein GL, Bedenbaugh P, Aertsen AMHJ. Neuronal assemblies. IEEE Trans. on Biomedical Engineering. 1989;36;4-14.
- Horwitz B, Frinston K, Taylor JG. Neural modeling and functional brain imaging: An overview. Neural Networks. 2000;13(8-9):829-46.
- Sommer FT, Hirsch JA, Wichert A. Theories, data analysis, and simulation models in neuroimaging - An overview. Exploratory Anal-ysis and Data Modeling in Functional Neuroimaging. 2013;1-13.
- Cordes D, Haughton VM, Arfanakis K, et al. Frequencies con-tributing to functional connectivity in the cerebral cortex in resting-state data. AJNR Am J Neuroradiol. 2001;22:1326-33.
- Posse S, Ackley E, Mutihac R, et al. High-speed real-time resting state fMRI using multi-slab echo-volumar imaging. Front Hum Neurosci. 2013;7:479.
- Hampson M, Peterson BS, Skudlarski P, et al. Detection of functional connectivity using temporal correlations in MR images. Hum Brain Mapp. 2002;15:247-62.
- Beckmann CF, De Luca M, Devlin DT, et al. Investigations into resting-state connectivity using independent component analysis. Philos Trans R Soc Lond B Biol Sci. 2005;360:1001-13.
- Seeley WW, Menon V, Schatzberg AF, et al. Dissociable intrinsic connec-tivity networks for salience processing and executive control. J Neurosci. 2007;27:2349-56.
- GR Wu, S Stramaglia, H Chen, et al. Map-ping the voxel-wise e ective connectome in resting state fMRI ", PLoS ONE 2013; e73670.
- Friston KJ. Functional and effective connectivity: a review. Brain Connect. 2011;1:13-36.
- Bullmore E, Sporns O. Complex brain networks: graph theoretical analysis of structural and functional systems. Nat Rev Neurosci. 2009;10:186-98.
- Mantini D, Perrucci MG, Del Gratta C, et al. Electrophysiological signatures of resting state networks in the human brain. Proc Natl Acad Sci USA. 2007;104(32):13170-5.
- Raichle ME, MacLeod AM, Snyder AZ, et al. A default mode of brain function. Proc Natl Acad Sci USA. 2001;98;676-82.
- Ramnani N, Owen AM. Anterior prefrontal cortex - Insights into function from anatomy and neuroimaging. Nat Rev Neurosci. 2004;5;184-1-94.
- Greicius MD, Srivastava G, Reiss AL, et al. Default-mode network activity distinguishes Alzheimers disease from healthy aging: ev-idence from functional MRI. Proc Natl Acad Sci USA. 2004;101;4637-42.
- Buckner RL, Snyder AZ. Molecular, structural, and func-tional characterization of Alzheimers disease: evidence for a relationship between default activity, amyloid, and memory. J Neurosci. 2005;25;7709-17.
- Li R, Yu J, Zhang S, et al. Bayesian network analysis reveals alterations to default mode network connectivity in individuals at risk for Alzheimer's disease. PLoS One. 2013;8(12):e82104.
- Le Bihan D, Breton E. Imagerie de diffusion in-vivo par rsonance mag-ntique nuclaire. C R Acad Sci (Paris). 1985;301(15):1109-12.
- Alexander L, Lee JE, Lazar M, et al. Diffusion tensor imaging of the brain. Neurotherapeutics. 2007;4(3):316-29.
- Basser P, Mattiello J, LeBihan D. MR diffusion tensor spectroscopy, imaging. Biophysical J. 1994;66(1): 259-67.
- Fillard P, Pennec X, Arsigny V, et al. Clinical DT-MRI estima-tion, smoothing, ber tracking with log-Euclidean metrics. IEEE Trans on Medical Imaging. 2007;26(11): 1472-82.
- Song SK, Sun SW, Ramsbottom M, et al. Dysmyelination revealed through MRI as increased radial (but unchanged axial) diffusion of water. NeuroImage. 2002;13(3):1429-36.
- Barzo P, Marmarou A, Fatouros P, et al. Contribu-tion of vasogenic and cellular edema to traumatic brain swelling measured by diffusion-weighted imaging. Journal of Neurosurgery. 1997;87(6):900-7.
- White T, Kendi AT, Lehericy S, et al. Disruption of hippocampal connectivity in children and adolescents with schizophreniaa voxelbased diffusion tensor imaging study. Schizophr Res. 2007;90:302-7.
- Zhou Y, Jr Dougherty JH, Hubner KF, et al. Abnormal connectivity in the posterior cingulate and hippocampus in early Alzheimer's disease and mild cognitive impairment. Alzheimers Dement. 2008;4:265-70.
- Zarei M, Patenaude B, Damoiseaux J, et al. Combining shape and connectivity analysis: an MRI study of tha-lamic degeneration in Alzheimer's disease. NeuroImage. 2010;49:1-8.
- Holt RL, Provenzale JM, Veerapandiyan A, et al. Structural connectivity of the frontal lobe in children with drug-resistant partial epilepsy. Epilepsy Behav. 2011;21;65-70.
- Vulliemoz S, Vollmar C, Koepp MJ, et al. Connectivity of the supplementary motor area in juvenile myoclonic epilepsy and frontal lobe epilepsy. Epilepsia. 2011;52:507-14.
- Ameis SH, Fan J, Rockel C, et al. Impaired structural connec-tivity of socioemotional circuits in autism spectrum disorders: a diffusion tensor imaging study. PLoS One. 2011;6;e28044.
- Billeci L, Calderoni S, Tosetti M, et al. White mat-ter connectivity in children with autism spectrum disorders: a tract-based spatial statistics study. BMC Neurol. 2012;12: 148.
- Jellison BJ, Field AS, Medow J, et al. Diffusion tensor imaging of cerebral white matter: a pictorial review of physics, ber tract anatomy, and tumor imaging pat-terns. AJNR Am J Neuroradiol. 2004;25;356-69.
- Mori S, Crain B, Chacko V, et al. Three-dimensional tracking of axonal projections in the brain by magnetic resonance imaging. Annals of Neurology. 1999;45(2):265-69.
- Yamada K, Sakai K, Akazawa K, et al. MR Trac-tography: A review of its clinical applications. Magn Reson Med Sci. 2009;8(4):165-74.
- Basser PJ, Pajevic S, Pierpaoli C, et al. In vivo ber tractography using DT-MRI data. Magn Reson Med. 2000; 44:625-32.
- Mori S, van Zijl PC. Fiber tracking: principles and strategies - a technical review. NMR Biomed. 2002;15:468-80.
- http://www.medicc.org/mediccreview/machado.html.
- Tuch D, Reese T, Wiegell M, et al. High angular resolution diffusion imaging reveals intravoxel white matter fiber heterogeneity. Magn Reson Med. 2002;48(4): 577-82.
- Wedeen V, Hagmann P, Tseng WY, et al. Mapping complex tissue architecture with diffusion spectrum magnetic resonance imaging. Magn Reson Med. 2005;54:(6) 1377-86.
- Tournier JD, Calamante F, Gadian D, et al. Direct estimation of the fiber orientation density function from diffusion-weighted MRI data using spherical deconvolution. NeuroImage. 2007;23(3):1176-85.
- Anderson W. Measurement of fiber orientation distributions using high angular resolution diffusion imaging. Magn Reson Med. 2005;54:1194-206.
- Jbabdi S, Behrens TE, Smith SM. Crossing fibres in tract-based spatial statistics. NeuroImage. 2010;49:249-56.
- Wedeen VJ, Wang RP, Schmahmann JD, et al. Diffusion Spectrum magnetic resonance Imaging (DSI) tractography of crossingfibers. NeuroImage. 2008;41:1267-77.
- Hagmann P, Cammoun L, Gigandet X, et al. MR connectomics: Principles and challenges. J Neurosci Methods. 2010;194:34-45.
- Wedeen VJ, Rosene DL, Wang RP, et al. The geometric structure of the brain ber pathways. Science. 2012;l335:1628-34.
- Xiao H, Yang Y, Jhui X, et al. Structural and functional connectivity in traumatic brain injury. Neural Regen Res. 2015;10(12):2062-71.
- Sporns O, Tononi G, Ktter. The Human Connectome: A Structural Description of the Human Brain. PLoS Comput Biol. 2005;1(4):e42.
- Biswal B, Yetkin FVMH, Hyde J. Functional connectiv-ity in the motor cortex of resting human brain using echo-planar MRI. Magn Reson Med. 1995;34:537-41.
- Greicius MD, Krasnow B, Reiss AL, et al. Functional con-nectivity in the resting brain: a network analysis of the default mode hypothesis. Proc Natl Acad Sci USA (PNAS). 2003;100(1):253-8.
- Luca DM, Beckmann C, Stefano DN, et al. FMRI resting state networks de ne distinct modes of long-distance interactions in the human brain. NeuroImage. 2005;29(4):1359-67.
- M. Fox, A. Snyder, J. Vincent, et al. The human brain is intrinsically organized into dynamic, anticorrelated functional networks", Proc Natl Acad Sci USA (PNAS), 102, 27, 9673-9678 (2005).
- Smith S, Fox P, Miller K, et al. Correspondence of the brain's functional architecture during activation and rest. Proc Natl Acad Sci USA (PNAS). 2009;106(31)13040-5.
- Sporns O. The human connectome: origins and challenges. Neuroimage. 2013;15(80):53-61.
- M. J. McKeown, S. Makeig, G. G. Brown, et al. Analysis of fMRI data by blind separation into independent spatial components", Hum Brain Mapp. 1998;160-188.
- Kiviniemi V, Kantola JH, Jauhiainen J, et al. Independent component analysis of nondeterministic fMRI signal sources. NeuroImage. 2003;19;253-60.
- Smith SM, Andersson J, Auerbach EJ, et al. Resting-state fMRI in the Human Connectome Project. NeuroImage. 2013;80:144-68.
- Marrelec G, Krainik A, Du au H, et al. Partial correlation for functional brain interactivity investigation in functional MRI. NeuroImage. 2006;32;228-37.


