Factors affecting the Diagnostic accuracy of FIBRISCAN: Systematic Analysis of Published data
2 King Fahd Hospital, Medina, Saudi Arabia
3 Wadi Bani Khalid Hospital, North of Sharquia, Oman
4 Royal Commission Hospital, Jubail, Saudi Arabia
5 Shendi University Hospital, Sudan
6 Wayne State University School of Medicine, Detroit, MI, USA
7 Specialized Medical Center, Riyadh, Saudi Arabia
8 Dallah Hospital, Riyadh, Saudi Arabia
9 Shendi Hospital, Sudan
10 Department of Epidemiology and Biostatistics, Schulich School of Medicine, University of Western Ont, Canada, Email: shoukrii.mohammed@gmail.com
Received: 15-Sep-2022, Manuscript No. PULJCDT-22-5356; Editor assigned: 19-Sep-2022, Pre QC No. PULJCDT-22-5356(PQ); Accepted Date: Oct 03, 2022; Reviewed: 25-Sep-2022 QC No. PULJCDT-22-5356(Q); Revised: 30-Sep-2022, Manuscript No. PULJCDT-22-5356(R); Published: 12-Oct-2022, DOI: 10.37532/puljcdt.2022.4(5).1-5
Citation: MohieldienM., Farfour A., Abdalla S., et al . Factors affecting the diagnostic accuracy of fibroscan: Systematic analysis of published data. J Clin Diagn Treat. 2022; 4(5):1-5
This open-access article is distributed under the terms of the Creative Commons Attribution Non-Commercial License (CC BY-NC) (http://creativecommons.org/licenses/by-nc/4.0/), which permits reuse, distribution and reproduction of the article, provided that the original work is properly cited and the reuse is restricted to noncommercial purposes. For commercial reuse, contact reprints@pulsus.com
Abstract
Background: Fibroscan is the name of a medical device used to help determine the health of patient’s liver. The term FibroScan, which is often confused for “fiber scan,” “fibro scan” or even “fibro liver scan,” is also used to refer to the FibroScan liver test itself. If the physician is recommending a FibroScan of the liver, the likely reason is to assess the health of the liver and detect liver fibrosis, which can indicate the presence and extent of liver damage or liver disease. FibroScan uses advanced ultrasound technology called transient elastography to measure liver stiffness.
Aim: The aim of this review is to capture to the greatest detail possible the number of the citations of the assessed the diagnostic accuracy of Fibroscan
Methods: The citation databases Web of Science and Scopus were searched for citations of the 2006, 2008 and 2010 Clinical Practice Guidelines including all measures of diagnostic accuracy such as sensitivity, specificity, positive, and area under receiver operating characteristic curve. Apply statistical methods to evaluate agreements between these diagnostic tests.
Results: The diagnostic accuracy of Fibroscan and other tools depend on the stage of fibrosis.
Conclusion: The three methods used to diagnose patients with liver fibrosis were comparable. Such findings support the assumption that the guideline dissemination strategies were and are quite robust.
Keywords
Diagnostic tests; Measures of diagnostic accuracy; Bland and Altman’s limits of agreement; Kruskal-Wallis test; Freidman’s test
Introduction
Accurate diagnosis of a disease is in many situations the first step Atoward its therapy. The performance of a diagnostic test is commonly commonly compared to an infallible or reference test usually called a “gold standard”, and then measured by a pair of indices such as Sensitivity (Se) and Specificity (Sp). Sensitivity is defined as the probability of testing positive given a person is diseased, and specificity is defined as the probability of testing negative given a person is disease-free. Other frequently used indices include Positive and Negative Predictive Values (PPV and NPV), and Positive and Negative Diagnostic Likelihood Ratios (LR+ and LR- ). PPV is defined as the probability of being diseased given a positive index test result, and NPV is defined as the probability of being disease-free given a negative index test result. An important measure of diagnostic accuracy that combines both sensitivity and specificity is the Area under the Receiver Operating Characteristics Curve, (AUROC).
The growing number of assessment instruments, as well as a rapid escalation in trial costs, has generated an increasing need for scientifically rigorous comparisons of diagnostic tests in clinical practice. Meta-analysis of Diagnostic Test (MA-DT) is a useful tool to combine evidence on diagnostic accuracies.
One of the diagnostic tools that we intend to measure its diagnostic accuracies combined from various studies is the FibroScan. Fibroscan is the name of a medical device used to help determine the health of a patient’s liver. The term FibroScan, which is often confused for “fiber scan,” “fibro scan” or even “fibro liver scan,” is also used to refer to the FibroScan liver test itself. If the physician is recommending a FibroScan of the liver, the likely reason is to assess the health of the liver and detect liver fibrosis, which can indicate the presence and extent of liver damage or liver disease. FibroScan uses advanced ultrasound technology called transient elastography to measure liver stiffness.
FibroScan Testing is a recently FDA-approved non-invasive diagnostic device used to measure liver scarring or fibrosis caused by several liver diseases. Like undergoing a conventional liver ultrasound exam, outpatient FibroScan testing is quick, painless, easy, and provides a non-surgical alternative to the traditional liver biopsy to assess liver damage.
Typically the physician may recommend a FibroScan test if the patient has one of the following chronic liver conditions:
• Autoimmune Hepatitis
• Cirrhosis
• Genetic Diseases (such as Hemochromatosis and Wilson’s disease)
• Hepatitis B
• Hepatitis C
• Alcoholic Liver Disease
• Non-Alcoholic Steatohepatitis (NASH)
Literature Review
The liver scan FibroScan can be used to help diagnose or monitor the progression of diseases affecting the liver, such as Nonalcoholic fatty liver disease. With Nonalcoholic Fatty Liver Disease (NAFLD), excessive amounts of fat are stored in the liver a cell, which puts the patient at risk of developing liver damage.
Alcoholic liver disease
Also known as alcoholic hepatitis, this is liver damage caused by drinking more alcohol than the liver can process, creating inflammation that can cause serious scarring (cirrhosis), which can lead to liver failure.
Nonalcoholic Steatohepatitis (NASH)
A form of NAFLD that is more aggressive than fatty liver and causes liver damage, including cirrhosis, and can lead to liver failure.
Viral infection
When the liver becomes infected with the Hepatitis B Virus (HBV) or the Hepatitis C Virus (HCV), it causes liver inflammation and puts the patient at an increased risk of developing cirrhosis or liver cancer, or suffering from liver failure.
Hemochromatosis
Excessive amounts of iron are stored in the organs, including the liver, which can become toxic for the body and create liver damage and other serious lifethreatening complications.
The FibroScan test can also be used to monitor liver health for patients following a liver transplantation.
What is a normal FibroScan result?
In general, the FibroScan will provide the patient with a:
• Cap Score: The amount of the patient’s liver with fatty change is measured by CAP score in decibels per meter (dB/m) and corresponds to the steatosis grade (S1, S2 or S3). The lower the percentage of patient’s liver with fatty change, the healthier the liver is and the lower the CAP score and steatosis grade from the FibroScan. A CAP score of 5% or lower indicates a healthy liver, while a CAP score of 5% to 33% with a steatosis grade of S1 indicates a mild fatty liver. CAP scores and steatosis grades higher than that indicate moderate to severe liver fat content and more liver damage.
• Fibrosis Score: Based on the amount of scarring in the liver, as measured in Kilopascals (kPa), the patient is assigned a fibrosis score. The lower the score, the less scarring the patient has on his/her liver, and the healthier the liver is. A normal result is between 2 kPa and 6 kPa. A fibrosis score of F0 to F1 indicates no liver scarring or mild liver scarring. The highest score possible is F4, which indicates advanced liver scarring, or cirrhosis. Depending on the patient’s unique health situation, the FibroScan result may not be all that is needed to paint a full picture of liver health. In those cases, the physician may use other tests, such as blood tests, imaging scans, or biopsies, in addition to the FibroScan.
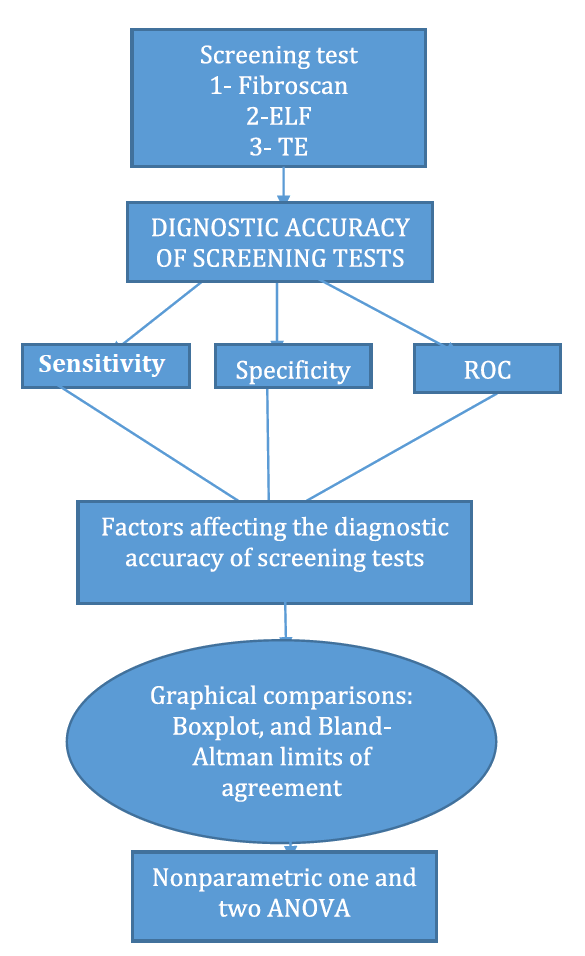
• This paper has several objectives. First, by reviewing the literature, we investigate the diagnostic accuracy of FibroScan and its clinical usefulness in predicting two conditions–significant histological liver fibrosis and cirrhosis. The secondary objectives are: (i) to assess variations in the diagnostic accuracy of FibroScan by cause of infection and by patient selection criteria for liver biopsy; (ii) to compare the diagnostic accuracy of the most common liver fibrosis serum biomarkers with that of transient elastography; (iii) to assess the gain in the likelihood of target conditions provided by non-invasive tests. Statistical methods will be used to combine the diagnostic accuracy indices across patients’ conditions within studies and across studies. Both graphical and analytical tools will be used to achieve the paper’s objectives. We included a flowchart to outline the structure of the paper (Figure 1).
Diagnostic Accuracy measured by the “Area under the receiver operating characteristic” or AUROC
We first review the data provided in which the main objective is to study the diagnosis and treatment of patients with chronic hepatitis, which relied on the staging of liver fibrosis. Antiviral therapy is proposed if moderate to severe (METAVIR stages F2 and F3) fibrosis is present. If cirrhosis is present, specific surveillance is initiated, for the early detection of hepatocellular carcinoma. Despite its limitations, liver biopsy is the usual procedure for staging fibrosis and is recommended by international guidelines.
Non-invasive procedures such as transient elastography (FibroScan), and serum biomarkers (particularly Fibrometre, Fibrotest, Hepascore and APRI) have been developed in order to avoid biopsy. Transient elastography is a new imaging technique measuring liver stiffness, i.e. its elasticity. The study described was a multicenter prospective cross-sectional diagnostic accuracy study. From June 15, 2006, to July 15, 2008, the hepatology departments of 23 French university.
Hospitals included all consecutive patients with chronic viral hepatitis due to Hepatitis C Virus (HCV) or Hepatitis B Virus (HBV) (with or without Human Immunodeficiency Virus HIV co-infection) in whom liver fibrosis assessment was indicated. Chronic hepatitis C was defined as the presence of anti-HCV anti- bodies for more than 6 months and positivity (except in documented successfully treated patients) of HCV RNA (Amplicor HCV Monitor). Chronic hepatitis B was defined as the presence of serum HBsAg (commercially available enzyme immunoassays) for more than 6 months
Statistical analysis
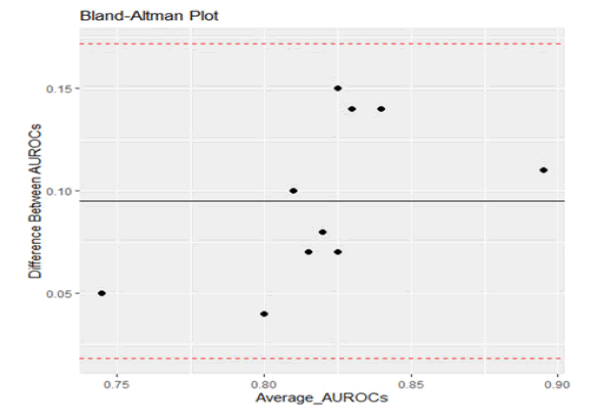
The diagnostic accuracy parameters of the non-invasive tests were estimated by comparison with liver biopsy used as the gold standard. Our aim here is to provide a methodology to confirm the agreement between the set of AUROC reported in 2006 to that reported in 2008.
For the diagnosis of significant fibrosis, overall accuracy was the same, sensitivity was lower when using published cut-offs and specificity was higher. The results of these two papers were presented in a completely descriptive manner. Here, we re-analyzed the data using the concept of reproducibility by comparing the results given in over two periods to test the stability of AUROC.
The FIBROSTIC study has compared the performance of transient elastography (FibroScan) with that of the main non-invasive biological methods of liver fibrosis assessment in a large representative sample of patients suffering from viral chronic hepatitis and consecutively selected for liver biopsy in routine clinical practice. The performance of FibroScan in predicting cirrhosis was high and higher than that of biomarkers. However, the performance of all the non-invasive methods in predicting significant fibrosis was moderate to poor. There was no difference in the overall accuracy of FibroScan. Liver biopsy has a distinct advantage in that commonly associated liver lesions, such as steatohepatitis and iron overload which can impact fibrosis progression and treatment response, can be diagnosed and investigated. However, it also has its limitations in staging fibrosis because of the heterogeneous distribution of fibrosis in the liver and the moderate reproducibility of readings. This can constitute a bias when a liver biopsy is used as the reference standard in the evaluation of diagnostic tests. This problem is common in diagnostic studies and has attracted much, but not very successful, statistical research [1-7].
As can be seen from Figure 2, following Bland and Altman methodology, plotting the difference in AUROC values against the mean values, all points fell within the limits of agreement. This indicates the close agreement between the sets of results (Table 1) [8].
TABLE 1 Regression Analysis Non-significant p-value indicates strong agreement between the two sets of measurements
| Parameter | Estimate | Std. Error | p-value |
|---|---|---|---|
| (Intercept) | -0.3828 | 0.2572 | 0.175 |
| Average | 0.5823 | 0.3132 | 0.1 |
|
F-statistic: 3.455 on 1 and 8 DF, p-value: 0.1001 |
|||
Effect of stage on the diagnostic accuracy: Patients with NAFLD
In this section, we shall review the diagnostic accuracy of Fibroscan for patients who have Non-Alcoholic Fatty Liver Disease (NAFLD). NAFLD is pathologically characterized by hepatic steatosis, lobular inflammation, hepatocyte ballooning, and liver fibrosis. According to the Fatty Liver Inhibition of Progression (FLIP) algorithm, NAFLD is diagnosed when the steatosis rate exceeds 5%. Liver fibrosis is associated with the prognosis of patients with NAFLD [9-11]. Therefore, assessments of hepatic steatosis and liver fibrosis are important in the daily clinical management of NAFLD. Although liver biopsy and pathology is the gold standard for assessing steatosis and fibrosis, this technique is invasive and expensive and suffers from sampling error and diagnostic variation among observers [12-14].
Recently, a new disease concept called Metabolic-Associated Fatty Liver Disease (MAFLD) was proposed, for which the Asian Pacific Association for the Study of the Liver described the diagnosis and management in its clinical practice guidelines [15, 16]. Thus, fatty liver disease, which is included in chronic liver disease concepts such as NAFLD and MAFLD, is being addressed globally
FibroScan provides two parameters—the Liver Stiffness Measurement (LSM) and the Controlled Attenuation parameter (CAP)—which are useful for assessing the degree of liver fibrosis and steatosis, respectively. It should be noted that CAP measurement requires special CAP software. FibroScan systems are equipped with two types of a probe for adults: an M probe for use in most patients and an XL probe for obese patients. It is important to note that the probes have provided conflicting measurements of both LSM and CAP [17]. In this review, we summarize the diagnostic accuracy and reliability of the measurement values of the LSM and CAP and investigate the factors affecting these measurements. We further compare the M and XL probes for LSM and CAP measurements. The LSM is a measure of the speed of the shear wave that is generated by a push pulse as it passes through the liver tissue. The shear wave propagates faster in hard liver tissue than in soft liver tissue. The LSM values range from 1.5 kPa to 75.0 kPa based on this property. Several studies have demonstrated the utility of the LSM for assessing liver fibrosis in patients with various chronic liver diseases including NAFLD. The authors concluded their investigation so that in patients with NAFLD, it is important to evaluate fibrosis and steatosis because fibrosis is associated with clinical prognosis, and steatosis is a criterion for NAFLD diagnosis. Various types of tests are available for the surveillance of NAFLD patients. Among them, the LSM and CAP obtained by FibroScan are useful and costeffective measures for the diagnosis of liver fibrosis and steatosis. However, users should bear in mind the factors that can influence measurements besides fibrosis and steatosis: the LSM is affected by inflammation, venous pressure, cholestasis, amyloid deposition, and food intake, and the CAP is affected by the BMI. Moreover, it is necessary to evaluate the reliability of the obtained LSM values based on the IQR/Med, but the IQR/Med is not associated with the reliability of CAP values. In addition, FibroScan users need to understand the reliability of measurement values and the factors influencing the measurement values. Especially in cases when there is a discrepancy between the FibroScan results and clinical data, such as liver biopsy, biomarker measures, and observations with other imaging modalities, FibroScan results should be interpreted carefully as a possible indicator of liver fibrosis and steatosis in clinical application. In the future, it would be desirable to study the LSM and the CAP values corrected for factors affecting their measurement values.
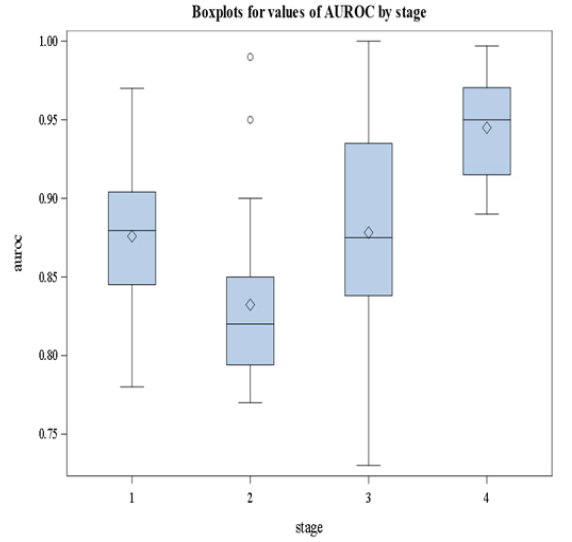
It is clear from Figure 3 that stage 4 has the largest median value of AUROC. We followed this graphical representation by methodological analysis using nonparametric Analysis Of Variance (ANOVA) where the dependent variable is the AUROC and the stages are the groups to be compared. The results are summarized in Tables 2 and 3. The overall pvalue is<0.05 given in Table 2 indicating the significant difference in AUROC values among groups. In Table 3, we show the results of the posthoc analysis. Pairwise comparisons indicate that stage 4 has a median AUROC that is significantly different from the other stages. Based on our re-analysis of the data we conclude that the diagnostic accuracy of FibroScan measured by the AUROC depends on the stage.
TABLE 2 Nonparametric ANOVA results
| Kruskal-Wallis Test | ||
|---|---|---|
| Chi-Square | DF | Pr > ChiSq |
| 24.1219 | 3 | <.0001 |
TABLE 3 Pairwise comparisons of AUROC among the stages
| Pairwise two-sided multiple comparison analysis | |||
|---|---|---|---|
| Dwass, Steel, Critchlow-fligner method | |||
| Variable: AUROC | |||
| Stage | Wilcoxon Z | DSCF Value | Pr > DSCF |
| 1 vs. 2 | 1.9307 | 2.7305 | 0.2151 |
| 1 vs. 3 | -0.1018 | 0.1440 | 0.9996 |
| 1 vs. 4 | -2.9445 | 4.1642 | 0.0171 |
| 2 vs. 3 | -2.4148 | 3.4150 | 0.0743 |
| 2 vs. 4 | -4.4188 | 6.2491 | <.0001 |
| 3 vs. 4 | -2.8687 | 4.0570 | 0.0215 |
Comparing the FIBROSCAN to other diagnostic procedures
For different causes of chronic liver disease assessment of liver fibrosis is important to estimate the prognosis and to determine surveillance strategies for liver cancer. In addition, for chronic viral hepatitis, the degree of liver fibrosis is one important parameter for the decision on antiviral therapy. At present, liver biopsy is still the most commonly used reference standard for the assessment of liver fibrosis. However, it is an invasive method associated with patient discomfort and in rare cases with serious complications [18]. In addition, the accuracy of liver biopsy is limited due to sampling error and significant intra- and inter-observer variability in histological staging [19, 20]. Therefore, research has focused on the evaluation of non- invasive methods for the assessment of liver fibrosis.
Transient Elastography (FibroScan, Echosens, France, [TE]) and the serological fibrosis marker FibroTest (Biopredictive, France, [FT]) have been evaluated most frequently. Fibro-Test consists of an algorithm of five fibrosis markers (alfa2-macroglobulin, apolipoproteinA1, haptoglobin, GGT, bilirubin). The Enhanced Liver Fibrosis Test (ELF, Siemens Diagnostics) consists of an algorithm of three fibrosis markers (hyaluronic acid, amino-terminal propeptide of type III collagen, tissue inhibitor of matrix metalloproteinase) [21-26].
• The aim of the referenced study was to analyze the ELF test using frozen serum samples from patients with chronic liver disease that received a liver biopsy, Transient Elastography (TE) and the FibroTest and to compare the results of the non-invasive tests using histology as reference method.
Transient Elastography (TE) was performed using FibroScan® (Echosens, France). This machine is equipped with a probe including an ultrasonic transducer mounted on the axis of a vibrator. A vibration transmitted from the vibrator towards the tissue induces an elastic shear wave that propagates through the tissue. These propagations are followed by pulse-echo ultrasound acquisitions and their velocity is measured which is directly related to tissue stiffness. Results are expressed in kilopascal. Details have been described in previous studies [27-30]. The examination was performed on the right lobe of the liver through the intercostal space. After the area of measurement was located, the examiner pressed the button of the probe to start the acquisition. The measurement depth was between 25 mm and 65 mm. As suggested by the manufacturer ten successful acquisitions were performed on each patient. Only TE results were obtained with 10 valid measurements. The diagnostic performance of ELF, FibroTest, and TE was assessed using Receiver-Operating-Characteristic (ROC)-curves. The ROCcurve represents a plot of sensitivity versus 1-specificity for all possible cut-off values for the prediction of the different fibrosis stages, respectively. The AUROC as well as 95%-CI of AUROC were calculated. AUROC values for different diagnostic criteria for the same data set were compared with the nonparametric DeLong test. Note that AUROC values for the different methods are correlated and that this test accounts for such correlations. Therefore, it may find significant differences in diagnostic accuracy even when confidence intervals of the single AUROC values, which ignore these correlations, are overlapping. Since two different fibrosis staging systems (Metavir and Ludwig’s) were used to classify histology, and both systems use scores ranging from 0 to 4, the scoring systems were pooled for the overall calculation of the mean-AUROC. In the case of diagnosing fibrosis stages greater than or equal to 2 versus stages less than 2, we also calculated the differences between mean advanced, versus mean non-advanced fibrosis stages (DANA)-adjusted AUROC according to Poynard et al. for a standardized DANA value of 2.5. Note that this adjustment was only validated for HCV [31].
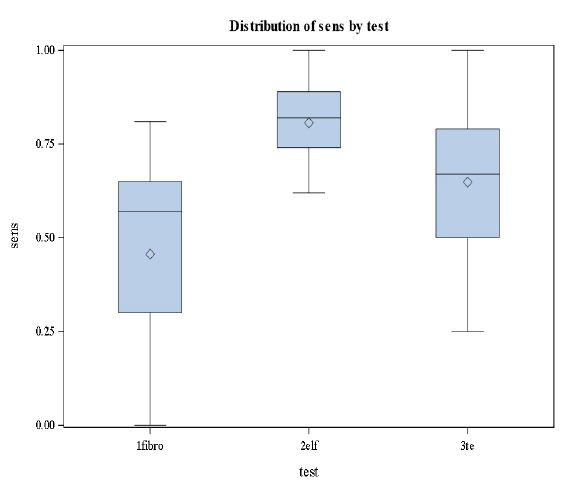
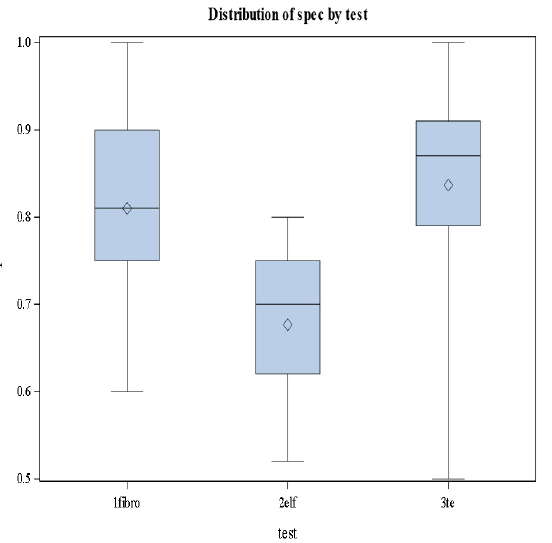
This was the first study, comparing transient elastography, FibroTest, and ELF in the same study population. The results of the three non-invasive methods using different approaches were comparable for the diagnosis of significant fibrosis and cirrhosis (Figures 4 and 5).
Based on the results in Figures 4 and 5 we conclude that there are significant differences in the levels of sensitivity among the three stages (p-value=0.0183<0.05) and no significant differences in specificities among the tests and the stages [32].
Concluding Remarks
This article provides statistical tools to compare between diagnostic accuracies of Fibroscan and other screening tests. This review focuses on the issue of agreement rather than testing equality of measures of diagnostic accuracies and controlling for the factors that affect these measures. It is hoped that the overview will make the methods more understandable and accessible to diagnostic test developers and researchers.
It is worth mentioning that prior studies have also observed that the risk of liver-related mortality specifically, is increased with more advanced fibrosis. The confidence in estimates for liver-related mortality by fibrosis stage, however, has varied considerably across studies. The authors estimated a five-fold increased risk with stage 4 fibrosis (HR 5.62, 95% CI 1.92–6.46) while Angulo et al. estimated a 47-fold increased risk with stage 4 fibrosis (HR 47.46, 95% CI 11.94–188.61). Furthermore, prior studies had suggested that the risk of liver-related mortality is only present after fibrosis progression to stage 2, and this risk is exponentially higher when transitioning from stage 3 to 4. In the pooled analysis, showed an increased risk for liver-related mortality was only seen after progression to stage 2 fibrosis. Though the risk was numerically higher even in patients with stage 1 fibrosis, the numbers of events were small and did not reach statistical significance.
The above analyses provide the readership with quantitative evidence that tests may have varying levels of diagnostic accuracies depending on the disease stage, and the pools of subjects forming the study sample.
Conflict of Interest
None declared by the authors.
Acknowledgement
The authors acknowledge the constructive comments made by two anonymous reviewers.
References
- Lambert ML, Hasker E, Van Deun A, et al., Rifampin and recurrence of tuberculosis among patients infected with HIV. Clinical infectious diseases.2003; 37(12):1719-20.
- Castera L. Pain experienced during percutaneous liver biopsy.Hepatology.1999;30:152930..
- Bedossa P, Dargère D, Paradis V. Sampling variability of liver fibrosis in chronic hepatitis C. Hepatology. 2003 ;38(6):1449-57..
- Maharaj B, Leary WP, Naran AD, et al.,Sampling variability and its influence on the diagnostic yield of percutaneous needle biopsy of the liver. The Lancet. 1986;327(8480):523-5..
- Friedrich–Rust M, Ong MF, Martens S, et al., Performance of transient elastography for the staging of liver fibrosis: a meta-analysis. Gastroenterology. 2008;134(4):960-74..
- Degos F, Perez P, Roche B, et al.,FIBROSTIC Study Group. Diagnostic accuracy of FibroScan and comparison to liver fibrosis biomarkers in chronic viral hepatitis: a multicenter prospective study (the FIBROSTIC study). Journal of hepatology. 2010 ;53(6):1013-21.
- Friedrich-Rust M, Rosenberg W, Parkes J, et al., Comparison of ELF, FibroTest and FibroScan for the non-invasive assessment of liver fibrosis. BMC gastroenterology.2010;10(1):1-8.
- Bradley EL, Blackwood LG. Comparing paired data: a simultaneous test for means and variances. The American Statistician.1989;43(4):234-5.
- Castera L, Vergniol J, Foucher J, et al. Prospective comparison of transient elastography, Fibrotest, APRI, and liver biopsy for the assessment of fibrosis in chronic hepatitis C. Gastroenterology. 2005;128(2):343-50.
- Talwalkar JA, Kurtz DM, Schoenleber SJ, et al. Ultrasound-based transient elastography for the detection of hepatic fibrosis: systematic review and meta-analysis. Clinical gastroenterology and hepatology. 2007;5(10):1214-20.
- Poynard T, Imbert-Bismut F, Munteanu M, et al. Overview of the diagnostic value of biochemical markers of liver fibrosis (FibroTest, HCV FibroSure) and necrosis (ActiTest) in patients with chronic hepatitis C. Comparative hepatology. 2004(1):1-2. 2004, 23:8.
- Shaheen AA, Wan AF, Myers RP. FibroTest and FibroScan for the prediction of hepatitis C-related fibrosis: a systematic review of diagnostic test accuracy. Official journal of the American College of Gastroenterology| ACG. 2007; 102(11):2589-600.
- Parkes J, Guha IN, Roderick P, et al., Enhanced Liver Fibrosis (ELF) test accurately identifies liver fibrosis in patients with chronic hepatitis C. Journal of viral hepatitis. 2011;18(1):23-31.
- Rosenberg WM, Voelker M, Thiel R, et al., Serum markers detect the presence of liver fibrosis: a cohort study.Gastroenterology.2004;127(6):1704-13.
- Thein HH, Yi Q, Dore GJ, et al. Estimation of stage‐specific fibrosis progression rates in chronic hepatitis C virus infection: a meta‐analysis and meta‐regression. Hepatology.2008;48(2):418-31.
- Bedossa P, Poynard T. An algorithm for the grading of activity in chronic hepatitis C. Hepatology. 1996 24(2):289-93.
- Ludwig J, Dickson ER, McDonald GA. Staging of chronic nonsuppurative destructive cholangitis (syndrome of primary biliary cirrhosis). Virchows Archiv A. 1978;379(2):103-12.
- Imbert-Bismut F, Messous D, Thibaut V, et al.,Intra-laboratory analytical variability of biochemical markers of fibrosis (Fibrotest) and activity (Actitest) and reference ranges in healthy blood donors. Clinical Chemistry and Laboratory Medicine (CCLM). 2004; 42(3):323-33.
- Ngo Y, Munteanu M, Messous D, et al., A prospective analysis of the prognostic value of biomarkers (FibroTest) in patients with chronic hepatitis C. Clinical chemistry. 2006;52(10):1887-96.
- Sandrin L, Fourquet B, Hasquenoph JM, et al., Transient elastography: a new noninvasive method for assessment of hepatic fibrosis. Ultrasound in medicine & biology. 2003 ;29(12):1705-13.
- Poynard T, Halfon P, Castera L, et al.,. Standardization of ROC curve areas for diagnostic evaluation of liver fibrosis markers based on prevalences of fibrosis stages. Clinical Chemistry.2007;53(9):1615-22.
- Bedossa P, Poitou C, Veyrie N, et al. Histopathological algorithm and scoring system for evaluation of liver lesions in morbidly obese patients. Hepatology. 2012 ;56(5):1751-9.
- Angulo P, Kleiner DE, Dam-Larsen S, et al., Liver fibrosis, but no other histologic features, is associated with long-term outcomes of patients with nonalcoholic fatty liver disease. Gastroenterology. 2015;149(2):389-97.
- Dulai PS, Singh S, Patel J, et al., Increased risk of mortality by fibrosis stage in nonalcoholic fatty liver disease: systematic review and meta‐analysis. Hepatology. 2017;65(5):1557-65.
- Piccinino F, Sagnelli E, Pasquale G, et al., Complications following percutaneous liver biopsy: a multicentre retrospective study on 68 276 biopsies. Journal of hepatology. 1986;2(2):165-73.
- Ratziu V, Charlotte F, Heurtier Aet al., Sampling variability of liver biopsy in nonalcoholic fatty liver disease. Gastroenterology. 2005; 128(7):1898-906.
- Yajima Y, OHTA K, NARUI T, et al., Ultrasonographical diagnosis of fatty liver: significance of the liver-kidney contrast. The Tohoku journal of experimental medicine. 1983; 139(1):43-50.
- Friedrich-Rust M, Rosenberg W, Parkes J, et al., FibroTest and FibroScan for the non-invasive assessment of liver fibrosis. BMC gastroenterology. 2010;10(1):1-8.
- Younossi ZM, Stepanova M, Rafiq N, et al.,Pathologic criteria for nonalcoholic steatohepatitis: interprotocol agreement and ability to predict liver‐related mortality. Hepatology.2011;53(6):187-482.
- Angulo P, Kleiner DE, Dam-Larsen S, et al., Liver fibrosis, but no other histologic features, is associated with long-term outcomes of patients with nonalcoholic fatty liver disease. Gastroenterology. 2015; 149(2):389-97.
- Kuwashiro T, Takahashi H, Hyogo H, et al.,Discordant pathological diagnosis of non‐alcoholic fatty liver disease: A prospective multicenter study. JGH Open. 2020;4(3):497-502.
- Tincopa MA. Diagnostic and interventional circulating biomarkers in nonalcoholic steatohepatitis. Endocrinology, Diabetes & Metabolism. 2020;3(4):e00177.


