Geo-Modeling approach to predicting of erosion risks utilizing RS and GIS data: A case study of Al-Hussain Basin, Tartous, Syria
Received: 07-Aug-2017 Accepted Date: Aug 28, 2017; Published: 05-Sep-2017, DOI: 10.4172/2591-7641.1000001
Citation: Abdo H. Geo-Modeling approach to predicting of erosion risks utilizing RS and GIS data: A case study of Al-Hussain Basin, Tartous, Syria. J Environ Geol. 2017;1(1):1-4.
This open-access article is distributed under the terms of the Creative Commons Attribution Non-Commercial License (CC BY-NC) (http://creativecommons.org/licenses/by-nc/4.0/), which permits reuse, distribution and reproduction of the article, provided that the original work is properly cited and the reuse is restricted to noncommercial purposes. For commercial reuse, contact reprints@pulsus.com
Abstract
Soil erosion is a major environmental problem in many parts of Syria generally, and in coast basin in western part particularly. The main objective of this paper is to integrate information from various sources including remote sensing and geographic information system data to accurately quantify and map the spatial distribution of the potential soil erosion risk in Alhusain basin, Tartous, Syria, using geospatial modeling and analysis tools.
The results show that 58% of the study basin has a low loss of soil, 27% moderate loss, 11% high loss, and 4% a very high loss, respectively. Alhusain basin is in the extremely severe level of soil erosion rates with about 15% of land affected by high and very high soil erosion risk. Therefore, the generated soil erosion map represents the effective base to spatial strategies for decisionmakers to avoid soil erosion risks and consequently to soil conservation.
Keywords
Soil erosion; Geospatial modelling; Remote sensing; Geographical information system
Introduction
Soil erosion by water is a common environmental problem which can affect the sustainable development and the agriculture of developing countries especially. It is a process composed of three stages: detachment, transport and finally deposition of soil [1]. Soil erosion occurs as a result of changes in agricultural practices, agricultural intensification, land degradation and global climate change [2]. It is estimated that 85% of global land degradation is associated with soil erosion [3]. Therefore, a precise assessment of soil erosion by water at watershed scale is needed.
The Mediterranean countries are particularly prone to erosion, because they are subject to prolonged dry periods followed by heavy erosive rains falling on steep slopes characterized by fragile soils. Mediterranean soils are fragile due to several reasons: i) The irregular and often intense precipitations that enhance erosion. ii) The large hilly and mountainous area with high steepness that accelerates soil erosion iii) The prevalence of high temperature that accelerates the mineralization of organic matter; and iv) The absence of an adequate soil-protective plant cover due to the climate’s severity and manmade activities (over-grazing, urbanization, exaggerated use of fertilizers and pesticides, overexploitation of fire wood, bad management and improper conservation practices, etc.) [4].
In the eastern part of the Mediterranean (Syrian, Lebanese, and Palestinian coasts), gradual land degradation is currently taking place. This is the result of rapid socio-economic changes, an increase in population growth and its associated demands, in addition to the abandonment of adopted land conservation measures and the misuse of land. Syrian soils suffer from soil erosion problem dramatically, at western coastal mountainous areas particularly, where it rains after long periods of drought at violent, focused, and short-duration form that no more than over several days at the annual total, along with very steep terrain, thus cliff tons of soil of fragile slopes [5,6].
Mapping of soil erosion is often difficult due to the complex interplay of many factors such as climate, land cover, soil, topography, and human activities [7]. The factors used in traditional methods were usually estimated or calculated from field measurements. The methods of quantifying soil loss based on erosion plots possess many limitations in terms of cost, representativeness, and reliability of the resulting data. They cannot provide spatial distribution of soil erosion due to the constraint of limited samples in complex environments. Therefore, mapping soil erosion in large areas is often very difficult using these conventional methods [8]. Moreover, assessment of land degradation, especially in the developing countries of the Mediterranean, is difficult due to the lack of data and financing for such an assessment.
The use of remote sensing (RS) and geographical information system (GIS) data make soil erosion estimation and its spatial distribution feasible with reasonable costs and better accuracy in larger basins [9]. For example, a combination of remote sensing, geographic information system, and Revised Universal Soil Loss Equation (RUSLE) provides the potential to estimate soil erosion on a cell-by-cell basis. However, the applications of GIS and RS in estimating soil erosion, discussed the difficulty and limitations of conventional methods, and identified that RS and GIS provided tremendous potential for improving soil erosion estimation [10,11].
Mapping of soil erosion risk within the Syrian coast basin has not attracted sufficient scientific attention; therefore, this paper explores the spatial distribution of erosion risks using a simplified RUSLE model based on the integration of remote sensing and GIS in Alhusain basin, Tartous, Syria. Hence, the output map is an important tool to assist soil conservation management and mitigate erosion risks.
Materials and Methods
Study area and data used
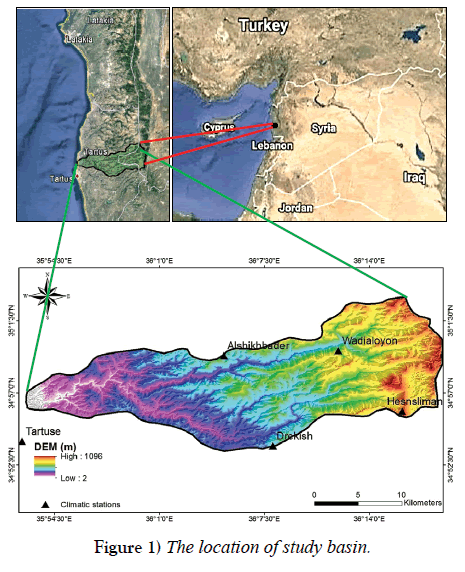
Alhusain basin is part of the Syrian coastal basin system. Alhusain River Basin as shown in Figure 1 on digital elevation model (ASTER GDEM Validation Team) with 384 km2 area, is located in the Tartous Governorate in the west of Syria. It extends between the latitudes of 34°.95’’ and 35°.12’’ North and longitude of 35°.87” and 36°.27” East. Alhusain basin is surrounded by the coastal mountains from the east, the Mediterranean from the west, Marqya basin from the North, and Al-Ghamqa basin from the south.
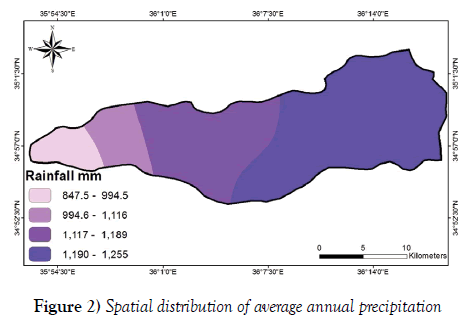
The elevations at the highest and lowest points are 1096 and 2 m above mean sea level, respectively. Various geological formations spread in the study basin, begin Jurassic in the top of basin, then formations of Cretaceous with basaltic ingots in the middle and bottom of it. Climatic conditions in the area subject to a Mediterranean climate with 1255 mm rainfall as shown in Figure 2, and average temperature is 19.5°C in summer and 12.4°C in winter [6].
Calculation of RUSLE parameters
The Revised Universal Soil Loss Equation (RUSLE) has been employed for this investigation. With the RUSLE model the average annual rate of soil loss can be estimated and the spatial distribution of the soil erosion risk map can be established. It is the most appropriate model that can be utilized to predict soil erosion loss based on the available data in Syria generally and Tartous specifically [12].
The RUSLE model represents how rainfall, topography, soil and vegetation affect rill and sheet soil erosion caused by raindrop impact and surface runoff [13]. It has been recognized as the most widely used empirical model to assess soil erosion loss, to estimate soil erosion risk and to guide soil conservation plans in order to control soil erosion [14,15]. The average annual soil loss (A) in tons per hectare per year was quantified using RUSLE, expressed by the following equation [16]:
A = R× K × LS ×C× P
where A is the average annual soil loss in tons per acre per year (t/ha/year), R the rainfall erosivity [MJ mm ha-1 h-1 year-1]; K the soil erodibility [ton ha-1 h MJ-1 ha-1 mm1], LS the hill slope length and steepness (dimensionless), C the cover management (dimensionless, values are ranging between 0.34 and 1), and P is the support practice (dimensionless, values ranging between 0 and 1). All factors of the above that refer to impact of raindrop, soil properties, topography, vegetation and maintenance factors in soil erosion and its loss were mapped in study basin using Arc GIS software, and depend on precipitation data, soil data, and DEM, respectively.
Rainfall erosivity (R factor)
The rainfall erosivity (R) factor represents the effect of rainfall intensity on soil erosion and requires detailed continuous data. R factor is often determined from rainfall intensity if such data are available. At present study, monthly rainfall data of 40 years (1970 - 2010) which is obtained from Directorate of Meteorology in Damascus (DMD) were used to calculate the R factor by the following Equation developed by Wischmeier [17]:

where R is a rainfall erositivity factor (MJ mm ha-1 h-1 per year); Pi is monthly rainfall (mm); P is an annual rainfall (mm). There are seven climatic stations established in and around Alhusain basin as shown in Figure 1 and Table 1.
| Climatic station | Total annual rainfall (m) | R factor (MJ mm ha-1 h-1 year-1) |
|---|---|---|
| Tartuse | 816 | 4.6 |
| Alshikhbader | 1172 | 16 |
| Drekish | 1203 | 23 |
| Wadialoyon | 1210 | 36 |
| Hesnsliman | 1255 | 42 |
Table 1: Climatic stations used in the study with R factor values for each station
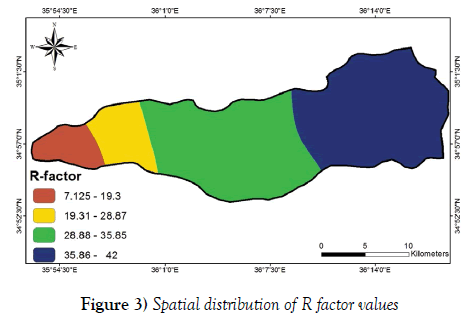
The R factor value of each climatic station established in and around the study basin was calculated for the period of 41 years (1970–2010) using the above equation, and the R factor map of the study area was produced with the inverse distance weighted average (IDW) interpolation method in GIS. In this study, the R values were calculated between 4.6 and 42 MJ mm ha-1 year-1, as shown Figure 3.
Soil erodibility factor (K)
The soil erodibility (K) factor is defined as the rate of soil loss per unit of R as measured on a unit plot, and it accounts for the influence of soil properties on soil loss during storm events. The K factor is related to soil texture, organic matter content, permeability class, and other factors, and it is largely determined by the soil type [18].
K factor is a product of soil characteristics in terms of its structure, texture, content of organic matter, and permeability. K factor has been mapped after obtaining the results of analysis of soil samples and determining organic matter, sand, silt, and clay content of each sample from Beitkammouneh Center for Agricultural Research in Tartous. K factor values of soil groups in the basin were estimated by using the following equation introduced by Lee [19]:

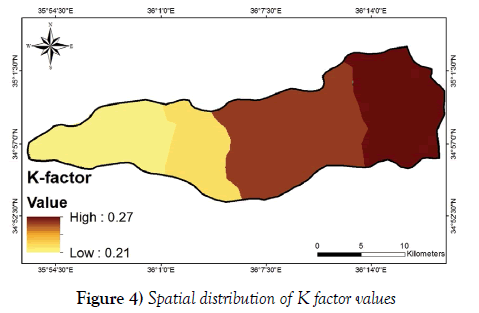
Where OM is the organic matter (%), s is soil structure class, p is permeability class, and M is aggregated variable derived from the granular soil texture: M = (% Msilt) × (% Silt + % Sand), and the modified silt (Msilt) is a percentage of grain size between 0.002 and 0.1 mm. By using the above equations, the K values (tons MJ-1 hmm-1) were computed and subsequently the K factor map was prepared (Figure 4).
Topographic factor (LS)
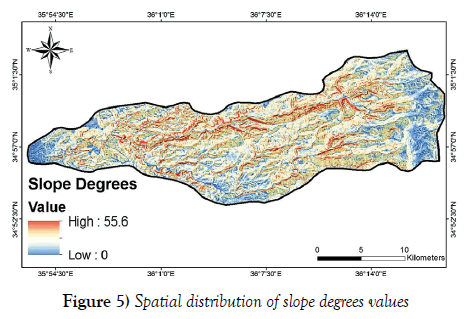
The slope length and steepness (LS) factor represents the effect of topography on soil erosion (19). The topographic factor includes the slope length factors (L) and slope steepness factors (S). The slope length factor (L) represents the effect of slope length on erosion, and the slope steepness factor (S) reflects the influence of slope gradient on erosion Figure 5.
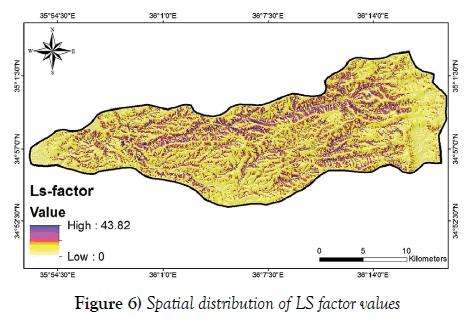
LS factor in the study was calculated in the GIS environment by using digital elevation model (DEM) with 30 m resolution and considering the interactions between topography and flow accumulation by using the following equation:

where flow accumulation is the grid layer of flow accumulation expressed as the number of grid cells, and cell size is the length of a cell side. LS values of the study basin are in the range of 0–51.3 and most of the study basin falls in between 0 and 41 (Figure 6).
Vegetation factor (C)
The vegetation controls soil erosion by means of its canopy, roots, and litter components; erosion also influences vegetation in terms of the composition, structure, and growth pattern of the plant community [20]. The Vegetation factor or C factor is the most important parameter included in calculating the amount of soil loss in RUSLE model depending on severe impact of the erosion of soils. Vegetation cover protects the soil by dissipating the raindrop energy before it reaches the soil surface. As such, soil erosion can be effectively limited with proper management of vegetation, plant residue and tillage [21].
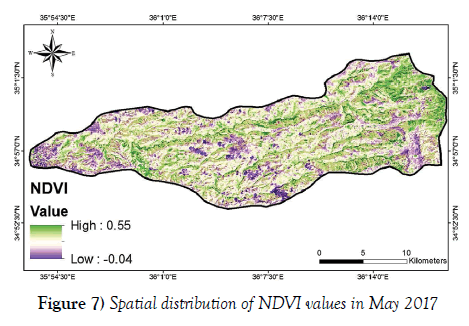
C-factor values were determined depending on the approaches created based on the reverse linear correlation between Normalized Difference Vegetation Index (NDVI) index and C factor [20]. NDVI index was calculated by using Landsat OLI 8 (earthexplorer.usgs.gov) that it taken at May 2017 through the following equation:

Where NIR and RED are near infrared and red bands, respectively.
Spatial distribution of NDVI values shown in Figure 7 that ranges between – 0.04 and 0.65. After obtaining NDVI index values, it can be calculated C-factor through the following equation:

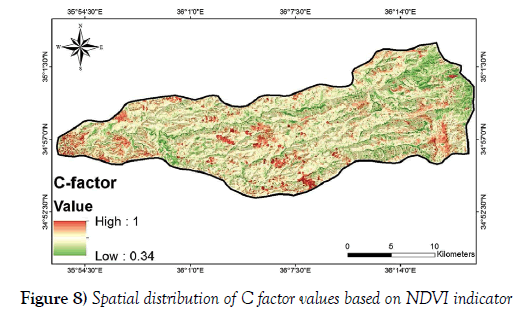
Figure 8 illustrates the spatial distribution of C factor values that ranged from 0.34 to 1. On this map, lower value of C factor indicates the area possesses good vegetative cover and higher value indicates barren land.
Conservation support practice factor (P)
The conservation practice factor (P) represents the ratio of soil loss by a support practice to that of straight-row farming up and down the slope and is used to account for the positive impacts of those support practices. These practices principally affect erosion by modifying the flow pattern, grade or direction of surface run-off, and by reducing the amount and rate of runoff. For cropland, the support practices considered included contouring, terracing, strip cropping, and subsurface drainage [14].
The value of P factor ranges from 0 to 1, the value approaching to 0 indicates good conservation practice and the value approaching to 1 indicates poor conservation practice [17]. According to field observations, agricultural practices observed in the study area consist of upslope and downslope tillage without any significant conservation support practices such as contouring or terracing. In order to neglect the P factor from soil erosion estimation, P equals to 1 as suggested by Wischmeier [17].
Results and Discussion
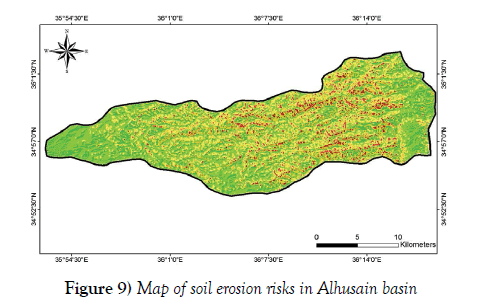
The map of soil erosion risks or A factor is calculated by multiplying R, K, LS and C factors in ArcGIS software environment, as shown in Figure 9. As the map illustrated, Alhusain basin is exposed to excessive rates of soil erosion. The annual soil loss estimated for Alhusain basin ranged from 0 to 110.32 ton/ha/yr. The mean soil erosion amount in the study basin was 55.16 ton/ha/year.
The quantitative output of predicted soil loss is reclassified into four ordinal categories for visual interpretation. As seen from the, results show that 58% was predicted to have low erosion rates between 0–19.9 ton/ha/year, 27% was estimated to have moderate erosion rates 21 - 50 ton/ha/year, 11% has high erosion rates 51–90 ton/ha/year, and 4% has high erosion rates 91–110.32 ton/ha/year, respectively. Meanwhile, Figure 9 also presents the spatial distribution of each class in Table 2.
| Soil loss class | Rate of soil loss class in ton/ha/year | Area (Km2) | Percentage (%) |
|---|---|---|---|
| Low | > 20 | 223 | 58 |
| Moderate | 21 - 50 | 105 | 27 |
| High | 51 - 90 | 42 | 11 |
| Very high | 91 – 110.32 | 14 | 4 |
Table 2: Classification of soil erosion risks in study basin.
As seen in Figure 8, the average annual soil erosion in most of the area is between 0 and 20 tha−1 year−1. With regard to the spatial variation, the areas with severe erosion rates were located in the central and eastern parts of the study basin, while the areas with low erosion rates were in the western and far eastern parts of study basin. However, it should be noted that areas with amount of erosion greater than 91 th−1 year−1 have been distributed in the watershed non-uniformly at the pixel level. However, Reason for areas of high soil erosion is related to steep slopes (Figure 5), poor conservation practices, low vegetation cover and high rainfall. These areas need suitable conservation measures to be adopted on a priority.
Conclusion
This study aimed to produce valuable information about soil erosion risk in Alhusain basin by using RUSLE model in GIS environment for planning appropriate conservation measures. The results show that soils susceptible to severe erosion with a soil loss more than 110 (t/ha/year). However, the annual rate of soil erosion will be helpful in determining of critical areas for implementation of soil conservation proceedings and effective checking of soil erosion and determine and manage appropriate use.
Acknowledgement
The author gratefully thank Prof. Dr. Issam Aldali and the academic staff of University of Tartous for unlimited support, and the editors and anonymous reviewers for constructive comments and suggestions to considerably improving the quality of this manuscript, and academic staff of University of Tartous for unlimited support, and Ghada Abu Ali for editing the English in an earlier version of this manuscript.
REFERENCES
- LAL R. Soil degradation by erosion. Land Degrad Dev 2001;12:519–539.
- Yang D, Kanae S, Oki T, et al. Global potential soil erosion with reference to land use and climate changes. Hydrol Process. 2003;17:2913–2928.
- Angima SD, Stott DE, O’neill MK, et al. Soil erosion prediction using RUSLE for central Kenyan highland conditions. Agric Ecosyst Environ. 2003;97:295–308.
- Abu Hammad, A. Watershed erosion risk assessment and management utilizing revised universal soil loss equation‐geographic information systems in the Mediterranean environments. Water and Environment Journal. 2011;25:149-162.
- Abdo H, Salloum J. Mapping the soil loss in Marqya basin: Syria using RUSLE model in GIS and RS techniques. Environ Earth Sci. 2017;76:114.
- Abdo H, Salloum J. Spatial assessment of soil erosion in Alqerdaha basin (Syria) Model. Earth Syst Environ. 2017;3:26.
- Mohammed S, Kbibo I, Alshihabi O, et al. Studying rainfall changes and water erosion of soil by using the WEPP model in Lattakia, Syria. Journal of Agricultural Sciences. 2016; 61:375-386.
- Rawat K, Mishra A, Bhattacharyya R. Soil erosion risk assessment and spatial mapping using LANDSAT-7 ETM+, RUSLE, and GIS—A case study. Arab J Geosci. 2016;9: 278-288.
- Ozsoy G, Aksoy E, Dirim MS, et al. Determination of soil erosion risk in the Mustafakemalpasa River Basin, Turkey, using the revised universal soil loss equation, geographic information system, and remote sensing. Environmental management. 2012;50:679-694.
- Sadeghi R, Mizuyama T. Applicability of the modified universal soil loss equation for prediction of sediment yields in Khanmirza watershed, Iran. Hydrological Sciences Journal. 2007;52:1068-1075.
- Boggs G, Devonport C, Evans K, et al. GIS-based rapid assessment of erosion risk in a small catchment in the wet/dry tropics of Australia. Land Degrad Dev. 2001;12: 417–434.
- Ranzi R, Le TH, Rulli MC. A RUSLE approach to model suspended sediment load in the Lo River (Vietnam): effects of reservoirs and land use changes. J Hydrol. 2012; 17–29.
- Wilson JP, Lorang MS. Spatial models of soil erosion and GIS. In: Wegener M, Fotheringham AS (eds) Spatial models and GIS: New potential and new models. Taylor and Francis, London, 2000: 83–108.
- Renard KG, Foster GR, Weesies GA, et al. Predicting soil erosion by water: a guide to conservation planning with the revised universal soil loss equation (RUSLE). Agriculture Handbook No. 703, USAD-ARS, Washington D.C., USA. 1997: 404.
- Prasannakumar V, Vijith H, Abinod S, et al. Estimation of soil erosion risk within a small mountainous sub-watershed in Kerala, India, using revised universal soil loss equation RUSLE and geo-information technology. Geosci Front. 2012;3:209–215.
- Wischmeier WH, Smith DD. Predicting rainfall erosion losses from cropland east of the rocky mountains: A guide for selection of practices for soil and water conservation, Agriculture Handbook, United States Department of Agriculture, Washington, DC, 1965:282.
- Wischmeier WH, Smith DD. Predicting rainfall erosion losses, a guide to conservation planning, USDA Handbook 537, US Government Printing Office, Washington, DC (1978).
- Gyssels G, Poesen J, Bochet E, et al. Impact of plant roots on the resistance of soils to erosion by water: A review. Progress in Physical Geography 2005; 22: 189–217.
- Lee S. Soil erosion assessment and its verification using the universal soil loss equation and geographic information system: a case study at Boun, Korea. Environ Geol. 2004;45:457–465.
- Karaburun A. Estimation of C factor for soil erosion modeling using NDVI in Buyukcekmece watershed Ocean. J Appl Sci. 2010; 3:77–85.
- Bonilla C, Reyes J, Magri A. Water erosion prediction using the revised universal soil loss equation (RUSLE) in a GIS framework, central Chile. Chilean Journal of Agricultural Research. 2010;70:159-169.


