Green synthesis, characterization and kinetic analysis of cellular uptake of glycans coated silver nanoparticles
2 Dipartimento di Scienze e Tecnologie Biologiche ed Ambientali, University of Salento, Lecce, Italy, Email: alessandro.buccolieri@unisalento.it
3 Dipartimento di Beni Culturali, Università del Salento Lecce, Italy, Email: gabriele.giancane@unisalento.it
Received: 07-Sep-2017 Accepted Date: Sep 21, 2017; Published: 06-Oct-2017
Citation: Manno D, Buccolieri A, Giancane G, et al. Green synthesis, characterization and kinetic analysis of cellular uptake of glycans coated silver nanoparticles. J Nanosci Nanomed September-2017;1(1):2-6.
This open-access article is distributed under the terms of the Creative Commons Attribution Non-Commercial License (CC BY-NC) (http://creativecommons.org/licenses/by-nc/4.0/), which permits reuse, distribution and reproduction of the article, provided that the original work is properly cited and the reuse is restricted to noncommercial purposes. For commercial reuse, contact reprints@pulsus.com
Abstract
Silver nanoparticles were obtained via totally green synthesis from silver nitrate using glucose as reducing agent and sucralose as capping agent. Physico-chemical characterization of AgNPs was performed by UV-Visible absorption and transmission electron microscopy (TEM) in order to correlate biological/toxicological responses with AgNPs features. A detailed study of silver nanoparticles (AgNPs) internalization process in human epitheloid cells of cervical cancer (HeLa) was performed versus time. Graphite furnace atomic absorption spectroscopy (GF-AAS) was used in order to assess the silver concentration effectively internalized by the cells. A kinetic model was developed to interpret the results.
Keywords
Green synthesis; Silver nanoparticles; Atomic absorption spectroscopy; Colloidal solution
Description
The development of nanotechnology is growing exponentially, achieving attractive developments in the biomedical field. Today, nanoparticles are considered a primary vehicle for targeted therapies because they can pass biological barriers and enter and distribute within cells. So far, several studies have shown that nanoparticle properties, such as size and surface, can influence their cellular uptake (He et al. 2010) [1]. Some reports show saturation of the intracellular nanoparticle concentration within hours [2], others after several days [3], we can therefore say that the impact of nanoparticles on cellular functions is at its infancy [4]. Also, great efforts are made in order to understand and estimate the risk for human health coming from the unintentional occupational or environmental exposure to nanoparticles [5].
The interaction of the nanoparticles with cells and living organisms in general, is so radically different from what happens with small organic molecules [6]. The molecules diffuse into and around the cell according to near-equilibrium principles. In contrast, nanoparticles are handled and taken into the cell by active, energy-dependent processes. In such active processes, the primary contact between nanoparticles and cells is mediated via the nanoparticle surface in the biological medium.
As has been observed, particles that are smaller than about 200 nm may enter cells with great ease [7]; particles less than 35 nm sometimes enter the nucleus [8,9], and particles that are less than 30 nm are capable of olfactory neuronal transport into the Central Nervous System (CNS) [10].
Understanding the cellular internalization of nanoparticles [11,12] is a problem central to many emerging applications of biological nanotechnology. Such applications include the design of tissue-implantable or subcellular sensors [13], drug-delivery systems [14] and novel photodynamic therapies [15].
In order to understand how NPs interact with cell or tissue organism there is the need for reproducible and verifiable data that can be interpreted with confidence. There is also considerable interest in advancing theoretical models to interpret the uptake of NPs onto cells.
This paper seeks a systematic approach to determine the uptake of NP in a quantitative way and to identify a theoretical model able to describe the whole process observed experimentally.
Unfortunately, quantitative measurement of NP up take still poses a technical challenge. It is still difficult to evaluate accurately real internalized NP because of membrane mediated interaction of NPs on the cell surface. This is one of the main limitations of spectroscopic methods that moreover are restricted to metallic particles. NPs can be observed inside the cells by transmission electron microscopy, but quantification of their uptake remains time and cost consuming [16].
NP uptake is generally quantified by flow cytometric analysis of fluorescently labeled NPs [17], or of NPs that have the capacity to scatter the light [18]. However, the up-take process needs to be thoroughly investigated to determine how many nanoparticles that interact with the cells.
Among metal NP, Ag-NP have been the subject of numerous in vitro and in vivo tests to provide information about their toxicity and the antimicrobial efficacy of AgNP is well known [19]. Because of this, silver is incorporated to different materials like textile fibers and wound dressings [20]. Among the noble metal nanoparticles, AgNPs present a series of features like simple synthesis routes [21], adequate and tunable morphology, intracellular delivery system [22].
Due to their properties, we chose AgNPs as interesting and suitable nanoparticles to analyze their uptake in human cervical cancer epithelioid cells (HeLa), a frequently used cellular model. The silver nanoparticles were synthesized through a green chemistry by using glucose as reducing and capping agent. UV-Visible absorption and transmission electron microscopy (TEM) were used to characterize the quality of the silver nanoparticles. Physico-chemical characterization of NPs is paramount in order to correlate biological/toxicological responses with NPs features. The concentration of NPs actually internalized was determined as a function of time and was compared to the viability of the cells. A kinetic model was developed to interpret the results. GF-AAS was used in order to assess the silver concentration effectively internalized by the cells.
Experimental
Reagents
Silver nitrate (AgNO3, 99%) and α-D-glucose (C6H12O6, 96%) was purchased from Sigma-Aldrich (Sigma-Aldrich Corporation St. Louis, MO, USA) and were used without further purification. Silver standard solutions was purchased from J.T. Baker (J.T. Baker, Phillipsburg, USA). The ultrapure water, with specific resistance less than or equal to 18.3 MΩcm, was obtained by a water purification system Human model Zeneer UP 900 (Human Corporation, Seoul, Korea).
Instruments
A double beam UV - Visible spectrophotometer PG Instruments model T80 (PG Instruments Ltd, Leicester, UK) was used in order to record the absorption spectra of colloidal solution of silver nanoparticles. The optical spectra were obtained by measuring the absorption, in the spectral range from 300 to 900 nm, in a quartz cuvette with a 1cm optical path. A Transmission Electron Microscopy (TEM) Hitachi model 7700 (Hitachi corporation, Japan) was used for images and electron diffraction patterns at 100 kV. The specimens were prepared for TEM observations by placing small droplets of AgNP solutions onto standard carbon supported 600 mesh copper grid and drying slowly in air naturally. An atomic absorption spectrometer graphite furnace (GF-AAS) Varian (Varian Inc. Palo Alto, USA) model Spectra AA- 600 was used for silver quantitative analysis. It was equipped with a silver hollow cathode lamp and an autosampler Varian model GTA-100, powered by high-purity argon as inert gas and water for the cooling process. Zeeman effect is the method for background correction.
Synthesis of silver nanoparticles
Silver nanoparticles were prepared by a green chemical method: 0.028 moles of α- D-glucose are solubilized in 100 ml of ultrapure water and brought to boiling for 5 minutes. Then 0.025 mmoles of silver nitrate aqueous solution was added to it. The mixture was kept on boiling for an hour under vigorous stirring. After sometime, the colour of the solutions turned pale yellow, indicating the formation of silver nanoparticles. With the progress of reaction, the colour changed from faint yellow to deep yellow and then reddish yellow. These colours also depending upon the concentration of silver nitrate used. For more details on the synthesis and characteristics of nanoparticles see the work of Filppo et al. [23].
Experimental design
For details about culture of Human epithelioid cervix carcinoma cells (HeLa) see the paper of Panzarini et al. [24] briefly, in Eagleʹs minimum essential medium (EMEM) (Cambrex, Verviers, Belgium) supplemented with 10% fetal calf serum (FCS), 2 mM L‐glutamine (Cambrex, Verviers, Belgium), 100 IU/ml penicillin and streptomycin solution (Sigma, St. Louis, MO) and 10000 U/ml nystatin (antimicotic solution) (Cambrex, Verviers, Belgium), in a 5% CO2 humidified atmosphere at 37°C. Cells were maintained in 75 cm2 flasks (concentration ranged between 2 × 10⁵ and 1 × 10⁶ cells/ml) by passage every 3 to 4 days. Then, 15 × 104 HeLa cells were incubated with (500 and 5000 ppm) and without silver colloidal solution for times in the range 0.25 to 48 h. The first two column of Table 1 resume the different culture sets considered in this paper. The chosen colloidal concentration (500 and 5000 ppm) and the cell concentration correspond to an amount of 2 × 10³ and 2 × 10⁴ AgNPs/cell that represent the less and the more toxic for HeLa cells respectively, as previously reported by Dini et al. [25].
| AgNP colloidal solution nominal concentration |
Time (h) |
AgT (ppb) |
AgT+C (ppb) |
DAg (ppb) |
σ (ppb) |
|---|---|---|---|---|---|
| 0.25 | 460 | 450 | 10 | 3 | |
| 0.5 | 470 | 460 | 10 | 3 | |
| 1 | 520 | 480 | 40 | 12 | |
| 2 | 490 | 460 | 30 | 9 | |
| 500 ppb | 3 | 560 | 520 | 40 | 13 |
| 6 | 540 | 530 | 10 | 7 | |
| 12 | 548 | 540 | 8 | 2 | |
| 24 | 536 | 530 | 6 | 2 | |
| 48 | 544 | 540 | 4 | 1 | |
| 0.5 | 2470 | 2447 | 23 | 3 | |
| 1 | 2520 | 2333 | 187 | 43 | |
| 2500 ppb | 3 | 2560 | 2157 | 403 | 89 |
| 6 | 2540 | 1963 | 577 | 117 | |
| 12 | 2548 | 2487 | 61 | 15 | |
| 24 | 2536 | 2513 | 23 | 8 | |
| 0.25 | 5060 | 5020 | 40 | 13 | |
| 0.5 | 5150 | 4900 | 250 | 15 | |
| 1 | 5420 | 4740 | 680 | 320 | |
| 2 | 5180 | 4180 | 1000 | 472 | |
| 5000 ppb | 3 | 5040 | 4020 | 1020 | 493 |
| 6 | 5400 | 5200 | 200 | 95 | |
| 12 | 5470 | 5430 | 40 | 12 | |
| 24 | 5390 | 5370 | 20 | 12 | |
| 48 | 5200 | 5190 | 10 | 11 |
Table 1: Average values (ppb) of silver concentration in the culture medium (AgT), in the culture medium with HeLa cells (Ag T +C) and amount of silver internalized by the cells (ΔAg) at different incubation time
Atomic Absorption Spectroscopy measurements
The main operating conditions for the determination of silver concentration: 328.1 nm the wavelength to measure absorbance, peak height the type of measurement of absorbance for silver quantitation, 4 mA the lamp current, 0.5 nm the width of slit lamp and 20 μl the sample injection volume. The temperature program for the graphite furnace was divided in seven steps: 85°C for 5 sec (3 sccm Ar), 95°C for 40 sec (3 sccm Ar), 120°C for 10 sec (3 sccm Ar), 400°C for 6 sec (3 sccm Ar), 400°C for 2 sec (0 sccm Ar), 2000°C for 3 sec (0 sccm Ar) and 2000°C for 2 sec (3 sccm Ar). It should be stressed that silver determination is made only in the heating stages 6 and 7. The calibration line was obtained by using three standard solutions (0.8 ppb, 2.4 ppb and 4.8 ppb) and a blank. The blank is made of ultrapure water and nitric acid 2%. The standards were obtained by diluting a stock standard solution 1000 ppm of silver in nitric acid 2% for trace element analysis (J.T. Baker, Phillipsburg, USA). Normal precautions for trace element analysis were observed throughout. For example, the glassware was cleaned by soaking for 48 hours in 10% nitric acid solution and then rinsed with ultrapure water. For each determination of the silver concentration, three measurements were made and the value reported is the average among them.
Silver concentration was determined by using GF-AAS on 15×104 HeLa cells incubated until 48 hrs with the lower (500 ppm) and with the higher (5000 ppm) amount of GF-AAS, as a function of incubation time (0.25, 0.5, 1, 2, 3, 6, 12, 24 and 48 h). The detection limit equal to 2 ppb.
Results and Discussion
AgNPs characterization
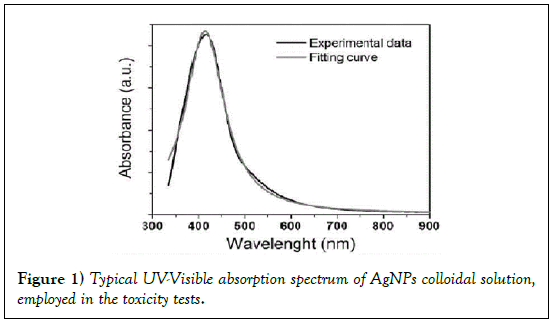
It is well known that the main feature of the absorption spectra for metallic nanoparticles is the surface plasmon (SP) resonance bands. From one up to three SP bands can be observed corresponding to three polarizability axes of the metallic nanoparticles. The optical properties of metallic nanoparticles ranging from microclusters to nanoparticles have been investigated mainly on the size effects concerning the shift of the SP resonance and the variation of the SP bandwidth. However, it has been demonstrated both theoretically and experimentally that the SP resonances of metal nanoparticles mainly depend on the particle shape than on the size [26]. The UV-Visible absorbance spectrum of nanoparticles in aqueous α-D-glucose solution, solid line displayed in Figure 1, presents a strong extinction band with a maximum at 420 nm, characteristic for the spherical nanoparticles. In order to determine the average nanoparticles dimension a numerical method based on the Mie theory has been employed [27]. The extinction cross section σext of a spherical particle with radius R embedded in a medium with dielectric function εm at a wavelength λ can be represented by: [28]

Here,  is the wave vector, aL(R, λ) and bL (R, λ) are the scattering
coefficients in terms of Ricatti-Bessel functions (ηL(x) and ψL(x)), which are
defined by the following equations:


x = kR is the size parameter and m = n /nm, where n is the complex refractive index of the particle and nm is the real refractive index of the surrounding medium. For very small particles, i.e., for x≪1, the electric field is approximately homogeneous within areas of the particle dimension, and it is sufficient to take into account only the first electric dipole term (i.e., L=1 in eq 1). For the numerical calculation of the extinction efficiency Qext (Qext= 2σext/πR2) an original OCTAVE code was used. The complex refractive index n(λ) for bulk silver was taken from the experimental work of Winsemius et al. [22]. All calculations were performed with water at 20°C as the surrounding medium where a wavelength-independent refractive index was assumed (nm=1.333). The calculated value for the extinction efficiency can be related to the experimentally observed absorption (A) by the following equation via the number density of particles per unit volume N and the path length of the spectrometer (d0), which is of 1 cm: [29]

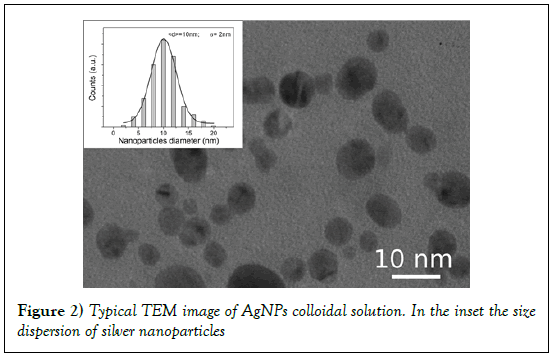
The best fit, reported in Figure 1 (dot line) was obtained with the following parameter values: N=5 × 10²⁰ AgNPs/l and R=5.2 ± 0.5 nm. These results, obtained by fitting the optical absorption curve in accordance with Mie’s theory, were confirmed by TEM observations. Figure 2 shows a typical image performed on freshly prepared solution. It is evident that the nanoparticles were mostly spherical and well dispersed. Statistical information on TEM images was obtained by processing the images using “Digital Micrograph” a Gatan software. To determine the nanoparticles size distribution a lot of digitalized TEM images, performed onto 50 randomly chosen fields, were processed. The observed nanoparticles have a size distribution ranging from 2 to 20 nm and an average size 2R = 10 nm with a standard deviation σ = 2 nm. The histogram showing the size dispersion of observed nanoparticles is reported in the inset of Figure 2.
Also statistical information about the shape confirm the visual inspection of TEM images: the estimated roundness was 0.9 ± 0.1, very close to 1 that is the expect value for perfect circular structures.
Silver determination
On the basis of three sets of GF-AAS measurements were determined the average values of silver concentration in the culture medium (AgT) and silver concentration in the culture medium with HeLa cells (AgT+C) to the fixed nine times of incubation (Table 1). In some case, AgT value was a little different from nominal one. The amount of silver internalized by the cells (ΔAg) was determined by the relationship:

The values obtained are given in Table 1. The error on the measurement (σ) is assumed to be equal to the maximum deviation. The determination of AgT, the actual silver concentration in the culture medium, is important to avoid systematic piping errors.
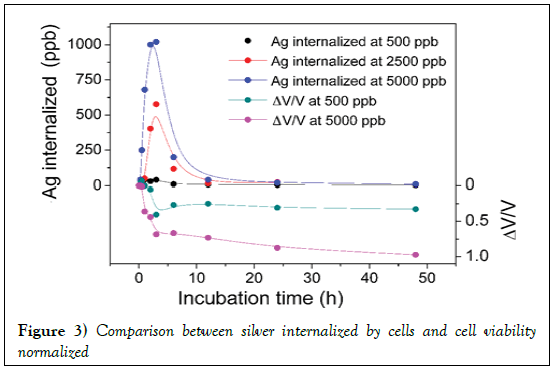
Figure 3 shows the trend of the silver up take by the cellule as a function of incubation time. Figure 3 shows, also, that HeLa cells do not continue take progressively silver, but there is a maximum after 2 h of incubation, after which the cells release the silver previously internalized into the culture medium. This phenomenon occurs is the lowest concentration of AgNP used (500 ppm), both at the highest concentration (5000 ppm).
Figure 3: Comparison between silver internalized by cells and cell viability normalized
These experimental data obtained by spectroscopic analysis of silver can be compared directly with cell viability. In Table 2, the cell viability is defined by the relationship:
| Incubation time (h) | DV/V 500 ppb | DV/V 5000 ppb |
|---|---|---|
| 0.5 | 0,06629 | -0,01128 |
| 1 | 4,21E-04 | -0,36011 |
| 1.5 | 0,02006 | -0,43804 |
| 3 | -0,40376 | -0,68329 |
| 6 | -0,26653 | -0,66684 |
| 12 | -0,24931 | -0,73088 |
| 24 | -0,30566 | -0,87548 |
| 48 | -0,3254 | -0,97388 |
Table 2: Incubation time normalized viability versus incubation time
ΔV/V= (Vt - Vc)/Vc
where Vc is the viability of the cells control and Vt is the viability of the cells incubated with silver nanoparticles.
The utility of a normalized viability lies in the fact that the dead cell correspond to negative values of ΔV/V whereas positive values of ΔV/V correspond to proliferation, and in a plot (as in Figure 3) one can have an immediate visualization of process. In addition, the comparison of silver internalized and normalized viability allows direct visualization of silver concentration internalized with respect to normalized viability of cells. It is evident that in the first minutes of incubation, the cells interact significantly with the silver nanoparticles that cause an immediate decrease in vitality.
A long time, however, it reaches a situation of equilibrium between the silver internalized by the cells and the silver released and the kinetics of the reaction is slower. The trend obtained, concentration-dependent, is qualitatively similar for the two concentrations of silver to which the cells have been subjected.
Kinetic model
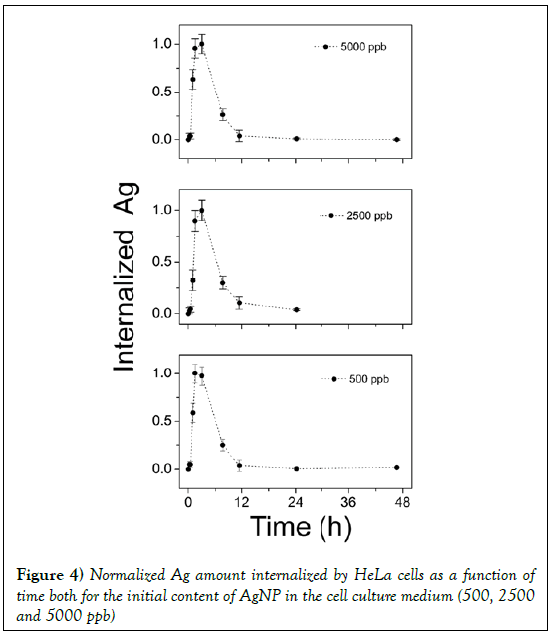
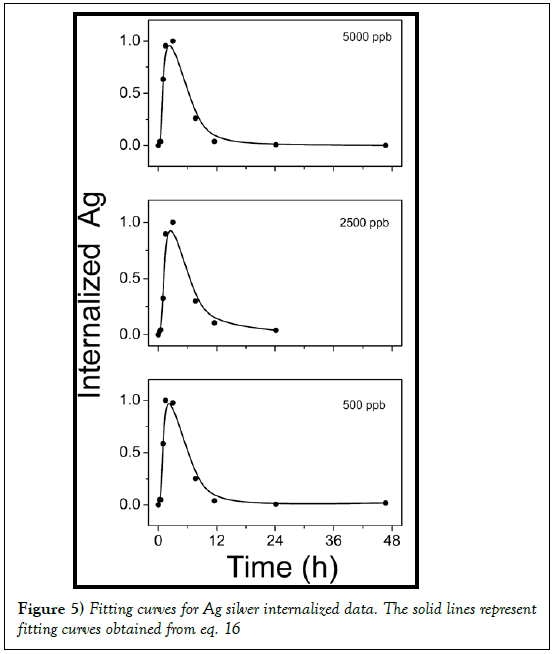
It is interesting to compare the behavior of internalized silver by normalizing the experimental data to the maximum value, as in Figure 4 for 500, 2500 and 5000 ppb. As can be seen, whatever the initial content of AgNP in the culture medium, it is observed a maximum value of internalized silver after 2 h. Then the internalized AgNPs concentration decrease. In an effort to explain the variation of internalized nanoparticles versus time, it is assumed that cells -AgNPs interaction can be described by a multistep approach. The feeding strategy is assumed to be an impulse. Let us suppose that at time t=0 a given concentration of Ag silver nanoparticles was dispersed into the cells culture medium. Then, some cells take all silver nanoparticles available. These cells, later on, can release nanoparticles spontaneously or after their death. In this way, the nanoparticles are again available and then internalized by cells that initially were not involved in the process, and so on.
Figure 4: Normalized Ag amount internalized by HeLa cells as a function of time both for the initial content of AgNP in the cell culture medium (500, 2500 and 5000 ppb)
The provision of nanoparticles to cell culture can be considered as an impulse C0δt, where the initial concentration C0 is delivered in a short time interval δt. The evolution of internalized silver concentration C can be described by the equation:
 where f is a constant that represents the uptake
kinetic rate by cells. The solution to the differential equation:
 with the initial condition equal to zero and an
impulse input x(t = 0) = 0 u(t)= M δ(t) is found using the Laplace transform.
In the Laplace domain, equation 7 becomes, when x is expressed in deviation
form:
 wheres denotes the Laplace variable and the solution
of this is then given by:

Therefore, going back to the time domain:
 Consequently, the expression of x in a nondeviation
form is:

If we consider a two steps cell uptake process; writing and solving the mass balances of two steps in cascade; the first step input is an impulse in concentration of magnitude C0. The mass balance on this step is thus given by equation:

with the set of conditions:  This leads to
the solution for C1:
 Then mass balances that describes the second
step is:

with the initial condition: C2 (t = 0)= 0, equation 15 can be transformed, using the expression previously found for C1(t), in:

So for two steps process typical solution is:

Note that this expression can easily be generalized to the case of j- steps in cascade. In this case, the solution to the jth step would be given by the expression:

The internalized silver concentration profile exhibits a zero value at the initial time. Then the concentration reaches a maximum where the largest amount of silver is available and finally decreases since the majority of the Ag is released by cells. All silver uptake kinetic step is taken as a first order reaction.
The two parameters describing this concentration profile are thus the uptake kinetic rate by cells f and the constant time τ. In Figure 5 the experimental data of internalized Ag by cells are reported. As evident under experimental data conditions the response on the concentration profile of internalized nanoparticles is well fitted by equation 17. So a two steps process is suitable to describe the Ag-cells interaction and the uptake kinetic.
Fitting parameters obtained are reported in Table 3.
| Ag Coll. Sol. (ppb) | f (h-1) | th) |
|---|---|---|
| 500 | 0.39±0.03 | 36±1 |
| 2500 | 0.38±0.03 | 35±1 |
| 5000 | 0.40±0.03 | 35±1 |
Table 3: Fitting parameters
As evident the kinetic parameters are almost independent to Ag concentrations. The response of HeLa cells seems governed by physiological processes inside of cells to respond to external stress than the intensity of the stress itself. Increasing the concentration of silver the cell population involved in the uptake process increases, but will not accelerate the individual interaction of cells with the silver colloidal solution.
Conclusion
Our previous data show that AgNPs induced modulation of cell viability, together with alteration of morphology and induction of ROS24. In particular, AgNPs were cytotoxic in NPs amount- and time- dependent manner. In fact, low AgNPs amount (500 ppb) had a pour toxic influence on cells, whereas high amount (5000 ppb) reduced the cell viability of about 97% within 48 hs. However, the biological responses evoked by the presence of AgNPs underlying a complex interaction and activation of mechanisms of action need to be further investigated.
For this reason we consider crucial to quantify the silver actually internalized by the cells and develop a kinetic model to describe it.
For the first time the GF-AAS was used in order to assess the silver concentration effectively internalized by the cells and a kinetic model was proposed to interpret the results.
The behaviour observed can be explained through the statement that AgNPs uptake can be described by a multistep approach. The feeding strategy is assumed to be an impulse. It is considered that at time t=0 a given concentration of Ag silver nanoparticles are dispersed into the cells culture medium. Then, some cells take all silver nanoparticles available. Cells can internalize the nanoparticles, then can release they spontaneously or after their death. In this way, the nanoparticles are again available to be internalized by cells that initially were not involved in the process, and so on. The proposed model is able to describe the experimental trend of AgNPs internalized by Hela cells and to determine two important kinetic parameters: the characteristic time and the constant f. It is very interesting to observe that these parameters are not concentration dependent.
This can be explained by observing that the up-take and release rates are not affected by the concentration of AgNPs added in the culture, but if a larger number of nanoparticles are present a greater number of cells are involved in the process of uptake of the AgNPs.
Our actual remarks provide an overall framework, both experimental and theoretical, for future studies to fully clarify the kinetic processes of uptake of by different cell types. The kinetic model can describe and predict the effect of NP on cells, then, will have significant impact on the safety and nanomedicine.
REFERENCES
- He C, Hu CY, Tang LYC, et al. Effects of particle size and surface charge on cellular uptake and biodistribution of polymeric nanoparticles: Biomaterials 2010;31:3657-66.
- Chithrani BD, Ghazani AA, Chan WCW. Determining the Size and Shape Dependence of Gold Nanoparticle Uptake into Mammalian Cells: Nano Lett 2006;6:662-8.
- Trono JD, Mizuno K, Yusa N, et al. Size, Concentration and incubation time dependence of gold nanoparticle uptake into pancreas cancer cells and its future application to X-Ray Drug Delivery System: J Radiat Res 2011;52:103-09.
- Gil PR, Oberdorster G, Elder A, et al. Correlating physico-chemical with toxicological properties of nanoparticles: the present and the future: ACS Nano 2010;4:5527-31.
- Simk M and Mattsson MO. Risks from accidental exposures to engineered nanoparticles and neurological health effects: A critical review: Particle and Fibre Toxicology 7:42-56.
- Walczyk D, Bombelli FB, Monopoli MP, et al. What the Cell Sees Bionanoscience: J Am ChemSoc 2010;132:5761-68.
- Wileya DT, Websterb P, Galea A, et al. Transcytosis and brain uptake of transferrin containing nanoparticles by tuning avidity to transferrin receptor: PNAS 2013;110:8662-67.
- Colvin VL. The potential environmental impact of engineered nanomaterials: Nat Biotech 2003;21:1166-70.
- Donaldson K, Stone V, Tran CL, et al. Nanotoxicology: Occup Environ Med 2004;61:727-8.
- Elder A, Gelein R, Silva V, et al. Translocation of Inhaled Ultrafine Manganese Oxide Particles to the Central Nervous System: Environmental Health Perspectives 2006;114:1172-78.
- Chithrani BD, Chan WCW. Elucidating the Mechanism of Cellular Uptake and Removal of Protein-Coated Gold Nanoparticles of Different Sizes and Shapes: Nano Lett 2007;7:1542-50.
- Heller DA, Strano MS. Single-Particle Tracking of Endocytosis and Exocytosis of Single-Walled Carbon Nanotubes in NIH-3T3 Cells: Nano Lett. 2008;8:1577-85.
- Heller DA, Jeng ES, Yeung TK, et al. Optical Detection of DNA Conformational Polymorphism on Single-Walled Carbon Nanotubes: Science 2006;311:508-11.
- Andhariya N, Upadhyay R, Mehta R, et al. Folic acid conjugated magnetic drug delivery system for controlled release of doxorubicin: J Nanopart Res 2013;15:1416-27.
- Qian HS, Guo HC, Mahendran R, et al. Mesoporous-Silica-Coated Up-Conversion Fluorescent Nanoparticles for Photodynamic Therapy: Small 2009;5:2285-90.
- Belade E, Armand L, Martinon L, et al. A comparative transmission electron microscopy study of titanium dioxide and carbon black nanoparticles uptake in human lung epithelial and fibroblastcell lines: Toxicol In Vitro 2012;26:57-66.
- Shapero K, Fenaroli F, Lynch I, et al. Time and space resolved uptake study of silica nanoparticles by human cells: MolBiosyst 2011;7:371-78.
- Zucker RM, Massaro EJ, Sanders KM, et al. Detection of TiO2 nanoparticlesin cells by flow cytometry: Cytometry 2010;77:677-85.
- Marin S, Vlasceanu GM, Tiplea RE, et al. Applications and toxicity of silver nanoparticles: a recent review: Curr Top Med Chem. 2015;15:1596-1604.
- Selvaraj D, Viswanadha VP, Elango S. Wound dressings – a review: Biomedicine 2015;5:24-8.
- Filippo E, Manno D, Buccolieri A, et al. Green synthesis of sucralose-capped silver nanoparticles for fast colorimetric triethylamine detection: Sensors And Actuators B-Chemical 2013;178:1-9.
- Heather HG, Dolly HC, David WG, et al. Nanoparticle Uptake: The Phagocyte Problem: Nano Today 2015;10:487–510.
- Filippo E, Manno D, Buccolieri A, et al. Shape-dependent plasmon resonances of Ag nanostructures: Superlattices And Microstructures 2010;47:66-71.
- Panzarini E, Mariano S, Vergallo C, et al. Glucose capped silver nanoparticles induce cell cycle arrest in HeLa cells: Toxicol In Vitro. 2017;41:64-74.
- Dini L, Panzarini E, Manno D, et al. Synthesis and In Vitro Cytotoxicity of Glycans-Capped Silver Nanoparticles, Nanomater. Nanotechnol 2011;1:58-64.
- Filippo E, Serra A, Buccolieri A, et al. Controlled synthesis and chain-like self-assembly of silver nanoparticles through tertiary amine: Colloids and Surfaces A: 2013;417:10–7.
- Mie G. Ann. Phys, BeitragezerOptiktruber Meiden speziellkolloidalerMetallosungen: Ann. Phys 1908;25:377-445.
- Bohren CF, Huffman DR. Absorption and scattering of light by small particles: Wiley-Interscience New York 1983.
- Winsemius P, van Kampen FF, Lengkeek HP, et al. Temperature dependence of the optical properties of Au, Ag and Cu: J PhysF 1976;6:15-83


