Identification of high-risk genes in triple-negative breast cancer by bioinformatics
2 Department of Oncology, The First Affliated Hospital of Soochow University, Jiangsu Province, China
3 The Wangjiangjing Hospital of Jiaxing, Zhejiang Province, China
Received: 23-Nov-2021, Manuscript No. PULHHR-21-3958; Editor assigned: 25-Nov-2021, Pre QC No. PULHHR-21-3958; Accepted Date: Dec 10, 2021; Reviewed: 06-Dec-2021 QC No. PULHHR-21-3958; Revised: 08-Dec-2021, Manuscript No. PULHHR-21-3958; Published: 16-Dec-2021, DOI: 10.37532/pulhhr.22.6(1).01-09
This open-access article is distributed under the terms of the Creative Commons Attribution Non-Commercial License (CC BY-NC) (http://creativecommons.org/licenses/by-nc/4.0/), which permits reuse, distribution and reproduction of the article, provided that the original work is properly cited and the reuse is restricted to noncommercial purposes. For commercial reuse, contact reprints@pulsus.com
Abstract
Background: Current research has failed to find a target gene for Triplenegative Breast Cancer (TNBC), which has resulted in the treatment for TNBC being less effective than that for other types of breast cancer. Finding high-risk genes for TNBC by bioinformatics may help to identify target genes for TNBC.
Methods: The gene expression data of 4 chips (GSE7904, GSE31448, GSE45827, GSE65194) which contains of normal breast tissue and TNBC tissue were obtained from the Gene Expression Omnibus. The Differentially Expressed Genes (DEGs) between normal breast tissue and TNBC tissue were identified. Gene Ontology (GO) functional annotation analysis and Kyoto Encyclopedia of Genes and Genomes (KEGG) pathway enrichment analysis of DEGs were performed by the DAVID website. Protein-protein interaction network analysis of DEGs was carried out by the STRING website, and the results were imported into Cytoscape. Then, module analysis was carried out by using the MCODE app. The online tool of the Kaplan-Meier Plotter website was used to analyse associations between Relapse-free Survival (RFS) and the expression of genes obtained by MCODE, and the Metastasis-free Survival (MFS) data from GSE58812 were used for survival verification. The difference in the expression of the identified genes was verified by the online tool of the UALCAN website.
Results: There were 127 up regulated and 293 down regulated genes in the DEGs. The GO and KEGG analysis showed that the DEGs were particularly enriched in mitotic nuclear division, extracellular space, heparin binding, and ECM-receptor interaction. MCODE obtained a total of 47 genes in 4 gene clusters, 29 of which were related to RFS. Survival verification indicated that 14 out of 29 genes were related to MFS, namely, CCNB1, AURKB, KIF20A, BUB1B, DLGAP5, CXCL11, CXCL9, CXCL10, CXCL12, IGF1, FN1, CFD, SGO2 and CDCA5.
Conclusion: We identified 14 genes as the high-risk genes for TNBC. Further research on these genes may identify the target genes of TNBC.
Keywords
Triple-negative breast cancer; High-risk gene; Target gene; Expressed genes; Prognostic; Survival
Abbreviations
TNBC: Triple-Negative Breast Cancer; ER: Estrogen Receptor; PR: Progesterone Receptor; HER-2: Human Epidermal Growth factor receptor-2; GEO: Gene Expression Omnibus; TCGA: The Cancer Genomes Atlas; DEGs: Differentially Expressed Genes; RFS: Relapse-free Survival; MFS: Metastasis-free Survival; GO: Gene Ontology; KEGG: Kyoto Encyclopedia of Genes and Genomes; DAVID: Database for Annotation; BP: Biological Process; CC: Cellular Component; MF: Molecular Function; PPI: Protein-protein Interaction; MCODE: Molecular Complex Detection
Introduction
GTriple-negative Breast Cancer (TNBC) refers to breast cancer that is negative for Estrogen Receptor (ER), Progesterone Receptor (PR) and Human Epidermal Growth Factor Receptor-2 (HER-2); TNBC accounts for 15%~20% of breast cancers [1,2]. TNBC favours young women and has the characteristics of strong invasiveness, easy metastasis and poor prognosis [3,4]. TNBC is a heterogeneous disease that can be classified into distinct molecular subtypes by gene expression profiling [5,6]. Until now, the target gene of TNBC has not been found. Chemotherapy is still the main method of systemic treatment, and the curative effect is not satisfactory, the side effect are unfavourable, and the patient survival time is short [7]. The study of target genes of TNBC may be important for improving the therapeutic effect and prolonging the survival period of TNBC patients.
Using bioinformatics to study the molecular mechanism of cancer has become a trend in cancer research. Public databases of biological information, such as the Gene Expression Omnibus (GEO) and The Cancer Genomes Atlas (TCGA), collect information on gene sequencing, methylation, mutation, miRNA, protein and other information; these databases have the advantages of including data from many kinds of organisms, many types of tumours, large sample sizes and so on. Through the screening of public databases, the Differentially Expressed Genes (DEGs) between tumour and normal tissues, as well as the relationship between genes and tumour prognosis, can be recognized, and this process can facilitate the identification of high-risk genes in tumours. It is a strategy for finding tumour target genes.
This paper used the GEO and TCGA databases to find the DEGs between TNBC and normal breast tissues and identified the genes that were related to Relapse-free Survival (RFS) and Metastasis-free Survival (MFS) as high-risk genes of TNBC, to provide direction for target genes.
Materials and Methods
Data source
Gene expression data from the GSE7904, GSE31448, GSE45827 and GSE65194 datasets were obtained from the GEO (https://www.ncbi.nlm. nih.gov/geo/). Gene expression data from GSE58812 was used as the source of survival verification. All these chips contains of gene information about normal breast tissue and TNBC tissue. The platform of these chips were GPL570 which complete coverage of the Human Genome U133 Set plus 6,500 additional genes for analysis of over 47,000 transcripts.
Identification of DEGs
TUsing the GEO2R online analysis tool provided by the GEO to screen the DEGs between normal breast tissue and TNBC, the screening conditions were logFC>2 (representing the upregulated of genes in TNBC) or logFC<-2 (representing the downregulated genes in TNBC) and adjusted P<0.05.
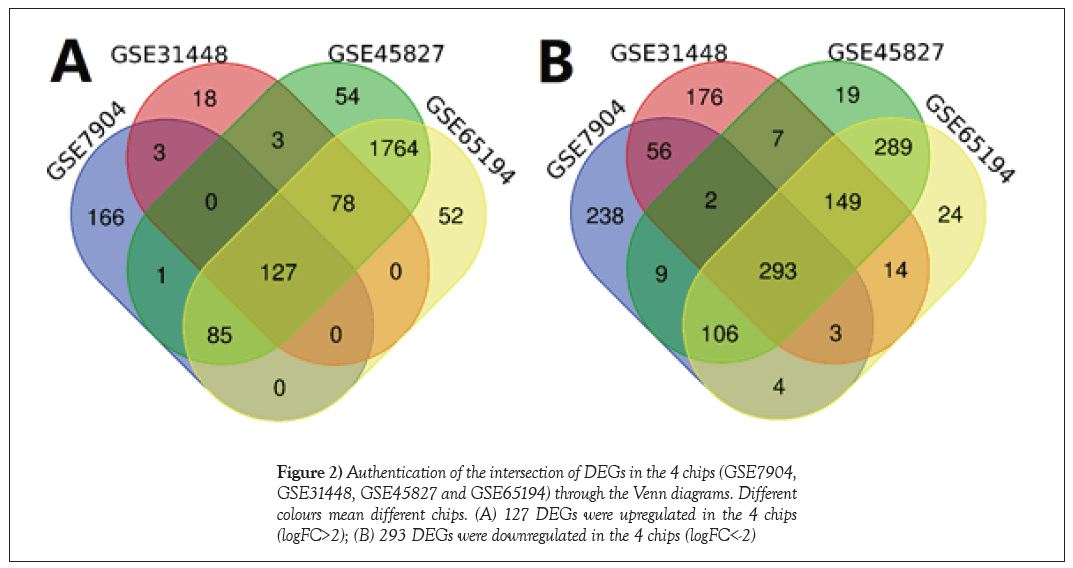
Using the Venn diagram online tool on the Van de Peer Lab website (http:// bioinformatics.psb.ugent.be/beg/tools/venn-diagrams), Venn diagrams of the DEGs of the above 4 chips were drawn to determine the intersecting DEGs as the final DEGs.
Functional and pathway enrichment analysis
Gene Ontology (GO) functional annotation analysis and Kyoto Encyclopedia of Genes and Genomes (KEGG) pathway enrichment analysis of DEGs were performed by the Database for Annotation, Visualization and Integrated Discovery (DAVID) tools (https://david.ncifcrf.gov/, Version: 6.8). GO analysis includes information on the Biological Process (BP), Cellular Component (CC) and molecular function (MF) of genes. BP refers to an ordered biological process with multiple steps, such as cell growth, differentiation and maintenance, apoptosis, and signalling. CC is used to describe the location of gene products in cells, such as the endoplasmic reticulum, nucleus or proteasome. MF refers to the function of a single gene product, such as binding activity or catalytic activity. KEGG is a database that systematically analyses the metabolic pathways of gene products in cells and is one of the most commonly used metabolic pathway analyses. The results were arranged in ascending order of P-value, and the top 6 were displayed separately.
Protein-protein interaction network and module analysis
The Protein-protein Interaction (PPI) network of DEGs was analysed by the online tool of the STRING website (http://string-db.org/, Version: 11.0), with the minimum required interaction score as highest confidence (0.900) and the combined score > 0.4. The results were imported into the Cytoscape software (Version: 3.7.1), and the sub-network was constructed by the Molecular Complex Detection (MCODE) app (node score cut-off=0.01, k-core=5, Version: 1.5.1).
Survival analysis and verification
Survival analysis of genes obtained from MCODE analysis was performed using an online tool from the Kaplan-Meier Plotter website (https://kmplot. com/analysis/). Set requirements were used as follows: split patients by=auto select best cutoff, survival: RFS, probe set options: only JetSet best probe set, restrict analysis to subtypes=ER negative and PR negative and HER2 negative, use following dataset for the analysis=all [8]. Genes with a log rank P-value<0.05 were verified by external data.
The external data were from GSE58812. Verification was performed using SPSS software (Version: 22.0). The receiver operating characteristic curve was used to evaluate the best cut-off value of the gene expression, and the patients were divided into a high expression group and a low expression group. The Kaplan-Meier method was used to compare the MFS of the two groups and P<0.05 was considered to indicate a significant difference.
Verification of gene expression
To verify the expression of the genes obtained from the above survival analysis, the online tool of the UALCAN website (http://ualcan.path.uab. edu) was used, and the data source was the TCGA. Genes with P<0.05 were considered high-risk genes of TNBC [9].
Data analysis process
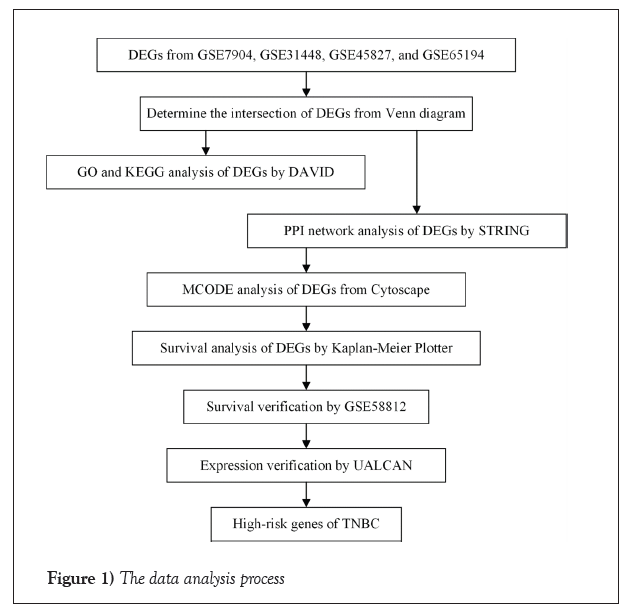
The data analysis process is shown in Figure 1.
Results
DEGs between normal breast tissue and TNBC tissue
There were total of 33 normal breast tissue samples and 132 TNBC tissue samples from GSE7904, GSE31448, GSE45827, and GSE65194 (Table S1). The intersection of DEGs from the 4 chips was found by the Venn diagram; from which 127 genes were upregulated and 293 genes were downregulated (Figure 2) (Table S2).
GO and KEGG analysis of DEGs
The GO analysis results of DEGs were as follows: 1) for BP, DEGs were particularly enriched in mitotic nuclear division, cell division, sister chromatid cohesion, positive regulation of cell proliferation, cell chemotaxis and cell proliferation; 2) for CC, DEGs were particularly enriched in extracellular space, extracellular region, proteinaceous extracellular matrix, midbody, chromosome, centromeric region and extracellular exosome; and 3) for MF, DEGs were particularly enriched in heparin binding, chemokine activity, integrin binding, protein homodimerization activity, protein binding and metalloendopeptidase activity. The KEGG analysis results of DEGs revealed enrichment in ECM-receptor interaction, oocyte meiosis, cell cycle, and focal adhesion, pathways in cancer and cytokine-cytokinereceptor interaction (Table 1).
| Category | Term | Description | Count | P-value |
|---|---|---|---|---|
| BP | GO:0007067 | mitotic nuclear division | 27 | 1.33E-10 |
| BP | GO:0051301 | cell division | 32 | 1.60E-10 |
| BP | GO:0007062 | sister chromatid cohesion | 17 | 1.75E-09 |
| BP | GO:0008284 | positive regulation of cell proliferation | 34 | 1.21E-08 |
| BP | GO:0060326 | cell chemotaxis | 12 | 2.54E-07 |
| BP | GO:0008283 | cell proliferation | 25 | 4.81E-06 |
| CC | GO:0005615 | extracellular space | 85 | 9.45E-18 |
| CC | GO:0005576 | extracellular region | 93 | 5.12E-17 |
| CC | GO:0005578 | proteinaceous extracellular matrix | 32 | 1.14E-13 |
| CC | GO:0030496 | midbody | 16 | 2.59E-07 |
| CC | GO:0000775 | chromosome, centromeric region | 11 | 5.71E-07 |
| CC | GO:0070062 | extracellular exosome | 102 | 1.31E-06 |
| MF | GO:0008201 | heparin binding | 20 | 4.24E-09 |
| MF | GO:0008009 | chemokine activity | 10 | 1.36E-06 |
| MF | GO:0005178 | integrin binding | 11 | 1.40E-04 |
| MF | GO:0042803 | protein homodimerization activity | 34 | 1.43E-04 |
| MF | GO:0005515 | protein binding | 236 | 1.60E-04 |
| MF | GO:0004222 | metalloendopeptidase activity | 11 | 2.56E-04 |
| KEGG | hsa04512 | ECM-receptor interaction | 11 | 8.58E-05 |
| KEGG | hsa04114 | oocyte meiosis | 12 | 1.48E-04 |
| KEGG | hsa04110 | cell cycle | 12 | 3.94E-04 |
| KEGG | hsa04510 | focal adhesion | 14 | 2.95E-03 |
| KEGG | hsa05200 | pathways in cancer | 21 | 3.32E-03 |
| KEGG | hsa04060 | cytokine-cytokinereceptor interaction | 15 | 4.69E-03 |
TABLE 1 The GO and KEGG analysis results
PPI network and module analysis
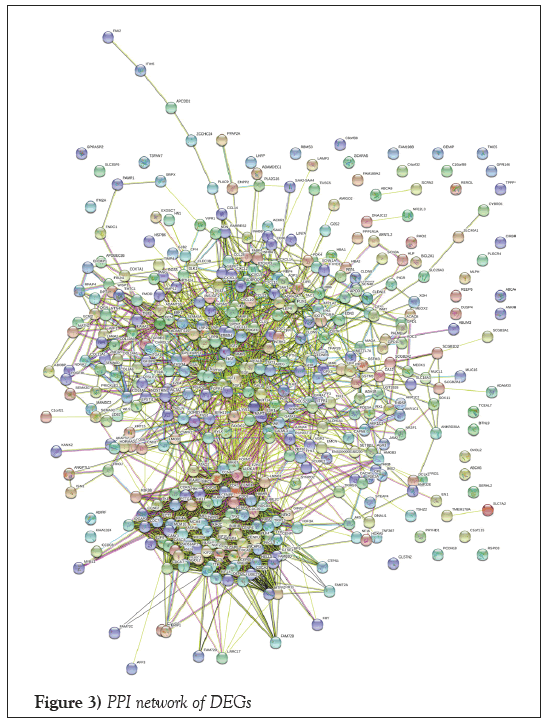
A total of 227 nodes and 1207 edges were displayed in the PPI network of DEGs (Figure 3). There were 4 gene clusters obtained from the module analysis, including 20 genes in cluster 1, 12 genes in cluster 2, 9 genes in cluster 3 and 6 genes in cluster 4 (Figure 4) (Table 2).
| Cluster | Gene symbol | Gene title | Node Status | Up/Down |
|---|---|---|---|---|
| MCODE 1 | NCAPG | non-SMC condensin I complex subunit G | Seed | Up |
| MCODE 1 | CCNB1 | cyclin B1 | Clustered | Up |
| MCODE 1 | KIF11 | kinesin family member 11 | Clustered | Up |
| MCODE 1 | ASPM | abnormal spindle microtubule assembly | Clustered | Up |
| MCODE 1 | AURKA | aurora kinase A | Clustered | Up |
| MCODE 1 | AURKB | aurora kinase B | Clustered | Up |
| MCODE 1 | KIF20A | kinesin family member 20A | Clustered | Up |
| MCODE 1 | CENPF | centromere protein F | Clustered | Up |
| MCODE 1 | KIF2C | kinesin family member 2C | Clustered | Up |
| MCODE 1 | TOP2A | topoisomerase (DNA) II alpha | Clustered | Up |
| MCODE 1 | BUB1B | BUB1 mitotic checkpoint serine/threonine kinase B | Clustered | Up |
| MCODE 1 | CDK1 | cyclin dependent kinase 1 | Clustered | Up |
| MCODE 1 | NUSAP1 | nucleolar and spindle associated protein 1 | Clustered | Up |
| MCODE 1 | DLGAP5 | DLG associated protein 5 | Clustered | Up |
| MCODE 1 | TTK | TTK protein kinase | Clustered | Up |
| MCODE 1 | CCNA2 | cyclin A2 | Clustered | Up |
| MCODE 1 | BIRC5 | baculoviral IAP repeat containing 5 | Clustered | Up |
| MCODE 1 | BUB1 | BUB1 mitotic checkpoint serine/threonine kinase | Clustered | Up |
| MCODE 1 | CDC20 | cell division cycle 20 | Clustered | Up |
| MCODE 1 | NDC80 | NDC80, kinetochore complex component | Clustered | Up |
| MCODE 2 | CXCL11 | C-X-C motif chemokine ligand 11 | Seed | Up |
| MCODE 2 | CXCL9 | C-X-C motif chemokine ligand 9 | Clustered | Up |
| MCODE 2 | CXCL10 | C-X-C motif chemokine ligand 10 | Clustered | Up |
| MCODE 2 | CCL28 | C-C motif chemokine ligand 28 | Clustered | Down |
| MCODE 2 | CXCL12 | C-X-C motif chemokine ligand 12 | Clustered | Down |
| MCODE 2 | CXCL2 | C-X-C motif chemokine ligand 2 | Clustered | Down |
| MCODE 2 | CX3CL1 | C-X3-C motif chemokine ligand 1 | Clustered | Down |
| MCODE 2 | GPSM2 | G-protein signaling modulator 2 | Clustered | Up |
| MCODE 2 | ADRA2A | adrenoceptor alpha 2A | Clustered | Down |
| MCODE 2 | CCL21 | C-C motif chemokine ligand 21 | Clustered | Down |
| MCODE 2 | PTGER3 | prostaglandin E receptor 3 | Clustered | Down |
| MCODE 2 | SAA1 | serum amyloid A1 | Clustered | Down |
| MCODE 3 | IGF2 | insulin like growth factor 2 | Seed | Down |
| MCODE 3 | IGF1 | insulin like growth factor 1 | Clustered | Down |
| MCODE 3 | FN1 | fibronectin 1 | Clustered | Up |
| MCODE 3 | CLU | clusterin | Clustered | Down |
| MCODE 3 | ALB | albumin | Clustered | Down |
| MCODE 3 | EGF | epidermal growth factor | Clustered | Down |
| MCODE 3 | CFD | complement factor D | Clustered | Down |
| MCODE 3 | FIGF | c-fos induced growth factor | Clustered | Down |
| MCODE 3 | VWF | von Willebrand factor | Clustered | Down |
| MCODE 4 | ZWINT | ZW10 interacting kinetochore protein | Seed | Up |
| MCODE 4 | SGO2 | shugoshin 2 | Clustered | Up |
| MCODE 4 | CDCA5 | cell division cycle associated 5 | Clustered | Up |
| MCODE 4 | CASC5 | kinetochore scaffold 1 | Clustered | Up |
| MCODE 4 | CENPI | centromere protein I | Clustered | Up |
| MCODE 4 | CENPU | centromere protein U | Clustered | Up |
TABLE 2 Four gene clusters obtained from the module analysis
Survival analysis and verification
Survival analysis of 47 genes from 4 gene clusters obtained by module analysis revealed that 29 of them were related to RFS, namely, NCAPG, CCNB1, KIF11, ASPM, AURKA, AURKB, KIF20A, CENPF, KIF2C, TOP2A, BUB1B, CDK1, NUSAP1, DLGAP5, CXCL11, CXCL9, CXCL10, CCL28, CXCL12, CXCL2, IGF2, IGF1, FN1, CLU, ALB, EGF, CFD, SGO2 and CDCA5 (Figures S1 and S2). Gene expression data from GSE58812 was used to verify the survival of these 29 genes, and 14 of them were found to be related to MFs, namely, CCNB1, AURKB, KIF20A, BUB1B, DLGAP5, CXCL11, CXCL9, CXCL10, CXCL12, IGF1, FN1, CFD, SGO2 and CDCA5 (Figure 5).
Expression verification
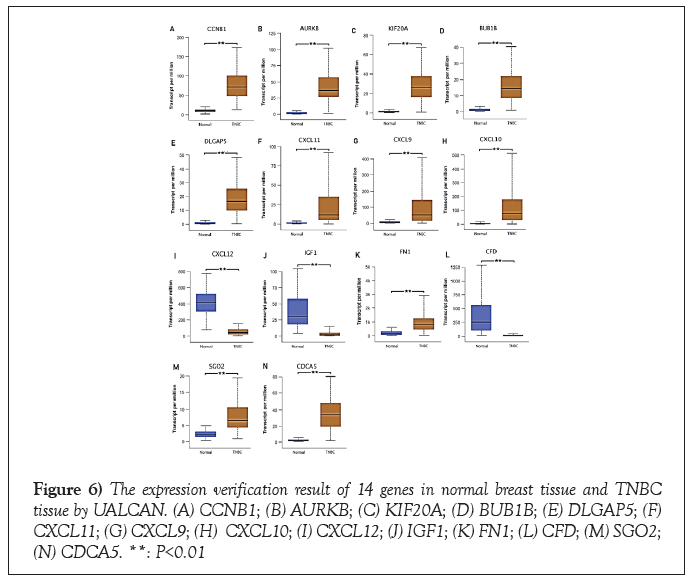
The expression of the above 14 genes in normal breast tissue and TNBC tissue was verified by the online tool of UALCAN. The data was from TCGA, including 114 normal breast tissue samples and 116 TNBC tissue samples. The results showed that the difference in the expression of all these genes between normal breast tissue and TNBC tissue was statistically significant. The upregulated genes were CCNB1, AURKB, KIF20A, BUB1B, DLGAP5, CXCL11, CXCL9, CXCL10, FN1, SGO2 and CDCA5. The downregulated genes were CXCL12, IGF1 and CFD. This result was consistent with the results in GSE7904, GSE31448, GSE45827, and GSE65194 (Figure 6).
Discussion
In this paper, the DEGs between normal breast tissue and TNBC tissue were obtained from 4 chips. The GO analysis indicated that the identified DEGs were related to mitotic nuclear division, cell division, sister chromatid cohesion, positive regulation of cell proliferation, cell chemotaxis, cell proliferation, heparin binding, chemokine activity, integrin binding, protein homodimerization activity, protein binding and metalloendopeptidase activity. The KEGG analysis indicated that the DEGs were related to ECMreceptor interaction, oocyte meiosis, cell cycle, focal adhesion, pathways in cancer and cytokine-cytokinereceptor interaction. This is consistent with the active proliferation of TNBC cells.
The PPI network shows the relationship between the proteins expressed by these genes. Due to the large number of proteins in the PPI network and the complex network relationship, it was necessary to further explore the more important gene modules through module analysis. PPI network analysis and module analysis of DEGs finally obtained 47 genes in 4 clusters. Survival analysis is an important method of studying tumour-associated genes. Due to the limitation of clinical follow-up data sources, RFS was used as the observation index of survival analysis, and MFS was used for verification in this paper. Through the survival analysis, 14 genes closely related to the prognosis of TNBC were obtained, namely, CCNB1, AURKB, KIF20A, BUB1B, DLGAP5, CXCL11, CXCL9, CXCL10, CXCL12, IGF1, FN1, CFD, SGO2 and CDCA5.
The cell cycle consists of five phases: G0 (gap 0), G1, S (synthesis), G2, and M (mitosis). Mitosis proceeds in five phases: prophase, prometaphase, metaphase, anaphase, and telophase [10].To ensure that only healthy cells proliferate, checkpoints have evolved that induce cell-cycle arrest in response to the detection of defects that may have arisen during DNA replication or other steps leading to mitosis [11]. The abnormal distribution of cells throughout the cell cycle is a hallmark of human cancer due to accumulating alterations of genes in the cell cycle pathway, possibly resulting in impaired abilities of cell division, cell proliferation and DNA damage response [12].
Among the high-risk genes found in this paper, the genes related to cell cycle and mitosis included AURKB, BUB1B, SGO2, CDCA5, CCNB1, DLGAP5 and KIF20A. These genes were overexpressed in TNBC and were associated with poor prognosis. AURKB is a member of the serine/threonine kinase family and is a major member of the chromosome passenger complex, which plays a key role in chromatin condensation and segregation and cytokinesis. Genetic instability caused by overexpression of AURKB is a direct cause of tumor formation [13,14]. Previous studies have found that AURKB expression is up regulated in leukemia, lymphoma, liver cancer and breast cancer and is associated with poor prognosis, which is consistent with the results of this study [15-18]. BUB1B encodes a kinase involved in the spindle assembly checkpoint and chromosome separation [19]. During the G2 phase, BUB1B inhibits anaphase-promoting complex/cyclosome activity, allowing cyclin B to accumulate before mitosis begins and slows the cell cycle [20]. Previous studies have found that BUB1B expression is upregulated in prostate cancer, breast cancer and lung cancer and is associated with poor prognosis [21-23]. SGO2 is a centromere-localized protein whose main function is to protect the cohesin of the sister chromatid from degradation. SGO2 regulates the localization of chromosomal passenger proteins and mediates spindle assembly and chromosome congression to prevent the generation of chromosomal instability associated with malignant cell transformation [24,25]. SGO2 is also a key substrate of AURKB, which plays a central role in ensuring faithful chromosome segregation [26]. CDCA5 is a substrate of the anaphase-promoting complex and participates in the regulation of sister chromatid cohesion [27]. Previous studies have found that CDCA5 expression is upregulated in lung cancer and hepatocellular carcinoma and is associated with poor prognosis [28,29]. CCNB1 belongs to a highly conserved family of cyclins that regulates the cell cycle and promotes cell proliferation. It is essential to control the cell cycle during G2/M transformation. Previous studies have found that CCNB1 overexpressed in ER-positive breast cancer and is associated with poor prognosis [30]. DLGAP5 belongs to the discs large-associated protein family, encodes the disc large homolog 7 (DLG7) protein, and controls on spindle stability [31,32]. The overexpression of DLGAP5 in colorectal cancer and prostate cancer is associated with poor prognosis [33,34]. KIF20A is a member of the kinesin super family - 6 that participates in spindle assembly and interacts with mitotic regulators [35]. The overexpression of KIF20A in hepatocellular carcinoma and lung adenocarcinoma is associated with poor prognosis [36,37].
CXCL9, CXCL10, CXCL11, and CXCL12 belong to the chemokine family. They are small molecular cytokines that are produced by many kinds of cells. After binding with the receptor, they mediate cell migration, activate antigenpresenting cells and immune active cells, and regulate the immune process of the body. In this study, we found that CXCL9-11 was overexpressed in TNBC, CXCL12 was not overexpressed, and patients with overexpressed CXCL9- 12 had a better prognosis. Possible reasons were that the large amount of CXCL9-12 can promote the infiltration of cytotoxic T lymphocytes into the tumour cell area to kill tumour cells and induce T or NK cells to inhibit tumour angiogenesis [38-43].
IGF1 is a key growth factor of the mammary terminal end bud and for ductal formation during development, and it also plays an important role in breast cancer development, progression and metastasis [44,45]. Upregulating IGF1 may promote TNBC progression [46]. However, in this study, IGF1 overexpression represented a better prognosis, which is difficult to explain and is worthy of further study.
FN1 encodes two forms of fibronectin, soluble plasma fibronectin-1 and insoluble cellular fibronectin-1 [47]. It regulates cell adhesion and migration processes [48]. Previous studies have found that overexpressed FN1 in oesophageal squamous cell carcinoma was associated with poor prognosis, which is consistent with this study [49].
CFD is a member of the serine protease family, which stimulates the transport of triglycerides to fat cells and inhibits lipolysis. CFD is a key component in the regulation of alternative pathways [50,51]. This study found that CFD gene expression was downregulated in TNBC and correlated with poor prognosis, which was consistent with the changes seen in gastric cancer and oral tongue squamous cell carcinoma [52,53].
Conclusion
In this paper, 14 genes related to TNBC survival were obtained by using bioinformatics and public databases. Some of the genes were related to cell proliferation and division, and some were related to chemokines. There was no NCBI article found to study the function of SGO2, DLGAP5, KIF20A and CFD in TNBC before, which means some novel research directions. It is necessary to study these genes and their biological pathways, as these studies may be a way to find the target genes of TNBC. There are also some shortcomings in this paper, such as the lack of experimental intervention data in the public database. In the future, it is necessary to design relevant experiments to verify the research results.
Declarations
Not applicable
Ethics Approval and Consent to Participate
Not applicable
Authors’ Contributions
XL and MT conceived and designed the study. XL and CPC collected and analyzed data. CPC and GHN prepared tables and fgures. XL and GHN drafted the manuscript. CPC and MT revised the manuscript. All authors read and approved the final manuscript.
Acknowledgements
Thanks to Professor Xiaofei Ye of the Second Military Medical University for his help in statistical analysis.
Availability of Data and Materials
The datasets generated and/or analysed during the current study are available in the Gene Expression Omnibus (https://www.ncbi.nlm.nih.gov/ geo/), The Cancer Genome Atlas database (https://cancergenome.nih.gov/ publications/publicationguidelines) and additional files.
Competing Interests
The authors declare that they have no competing interests.
Funding
This work was supported by the Clinical Research Project of Zhejiang Medical Association (2018ZYC-A90).
Consent to Publication
Not applicable.
REFERENCES
- Bauer KR, Brown M, Cress RD, et al. Descriptive analysis of Estrogen Receptor (ER)-negative, Progesterone Receptor (PR)-negative, and HER2-negative invasive breast cancer, the so-called triple-negative phenotype: A population-based study from the California cancer Registry. Cancer. 2007;109(9):1721-1728.
- Metzger-Filho O, Tutt A, de Azambuja E, et al. Dissecting the heterogeneity of triple-negative breast cancer. J Clin Oncol. 2012;30(15):1879-1887.
- Prat A, Adamo B, Cheang MC, et al. Molecular characterization of basal-like and non-basal-like triple-negative breast cancer. Oncologist. 2013;18(2):123-133.
- Azim HA Jr, Michiels S, Bedard PL, et al. Elucidating prognosis and biology of breast cancer arising in young women using gene expression profiling. Clin Cancer Res. 2012;18(5):1341-51.
- Lehmann BD, Jovanović B, Chen X, et al. Refinement of triple-negative breast cancer molecular subtypes: Implications for neoadjuvant chemotherapy selection. PLoS One. 2016;11(6):68.
- Jiang YZ, Ma D, Suo C, et al. Genomic and transcriptomic landscape of triple-negative breast cancers: subtypes and treatment strategies. Cancer Cell. 2019;35(3):428-40.
- Hwang SY, Park S, Kwon Y. Recent therapeutic trends and promising targets in triple negative breast cancer. Pharmacol Ther. 2019;199(1):30-57.
- Györffy B, Lanczky A, Eklund AC, et al. An online survival analysis tool to rapidly assess the effect of 22,277 genes on breast cancer prognosis using microarray data of 1,809 patients. Breast Cancer Res Treat. 2010;123(3):725-731.
- Chandrashekar DS, Bashel B, Balasubramanya SAH, et al. UALCAN: A portal for facilitating tumor subgroup gene expression and survival analyses. Neoplasia. 2017;19(8):649-658.
- Dominguez-Brauer C, Thu KL, Mason JM, et al. Targeting mitosis in cancer: emerging strategies. Mol Cell. 2015;60(4):524-536.
- Malumbres M, Barbacid M. Cell cycle, CDKs and cancer: a changing paradigm. Nat Rev Cancer. 2009;9(3):153-166.
- Alimbetov D, Askarova S, Umbayev B, et al. Pharmacological targeting of cell cycle, apoptotic and cell Adhesion signaling pathways implicated in chemoresistance of cancer cells. Int J Mol Sci. 2018;19(6).1690.
- Slattery SD, Moore RV, Brinkley BR, et al. Aurora-C and aqurora-B share phosphorylation and regulation of CENP-A and Borealin during mitosis. Cell Cycle. 2008;7(6):787-795.
- Shao H, Ma C, Zhang X, et al. Aurora B regulates spindle bipolarity in meiosis in vertebrate oocytes. Cell Cycle. 2012;11(14):2672-2680.
- Goldenson B, Crispino JD. The aurora kinases in cell cycle and leukemia. Oncogene. 2015;34(5):537-545.
- Friedberg JW, Mahadevan D, Cebula E, et al. Phase II study of alisertib, a selective aurora A kinase inhibitor, in relapsed and refractory aggressive B- and T-cell non-Hodgkin lymphomas. J Clin Oncol. 2014;32(1):44-50.
- Dauch D, Rudalska R, Cossa G, et al. A MYC-aurora kinase A protein complex represents an actionable drug target in p53-altered liver cancer. Nat Med. 2016;22(7):744-753.
- Zhang Y, Jiang C, Li H, et al. Elevated eurora B expression contributes to chemoresistance and poor prognosis in breast cancer. Int J Clin Exp Pathol. 2015;8(1):751-757.
Google Scholar Cross Ref
- Guo Y, Kim C, Ahmad S, et al. CENP-E--dependent BubR1 autophosphorylation enhances chromosome alignment and the mitotic checkpoint. J Cell Biol. 2012;198(2):205-217.
- Malureanu LA, Jeganathan KB, Hamada M, et al. BubR1 N terminus acts as a soluble inhibitor of cyclin B degradation by APC/C(Cdc20) in interphase. Dev Cell. 2009;16(1):118-131.
- Fu X, Chen G, Cai ZD, et al. Overexpression of BUB1B contributes to progression of prostate cancer and predicts poor outcome in patients with prostate cancer. Onco Targets Ther. 2016;9(1):2211-2220.
- Ocaña A, Pérez-Peña J, Díez-González L, et al. Transcriptomic analyses identify association between mitotic kinases, PDZ-binding kinase and BUB1, and clinical outcome in breast cancer. Breast Cancer Res Treat. 2016;156(1):1-8.
- Chen H, Lee J, Kljavin NM, et al. Requirement for BUB1B/BUBR1 in tumor progression of lung adenocarcinoma. Genes Cancer. 2015;6(4):106-18.
- Vanoosthuyse V, Prykhozhij S, Hardwick KG. Shugoshin 2 regulates localization of the chromosomal passenger proteins in fission yeast mitosis. Mol Biol Cell. 2007;18(5):1657-1669.
- Rivera T, Ghenoiu C, Rodríguez-Corsino M, et al. Xenopus Shugoshin 2 regulates the spindle assembly pathway mediated by the chromosomal passenger complex. EMBO J. 2012;31(6):1467-1479.
- Tanno Y, Kitajima TS, Honda T, et al. Phosphorylation of mammalian Sgo2 by aurora B recruits PP2A and MCAK to centromeres. Genes Dev. 2010;24(19):2169-2179.
- Zhang N, Pati D. Sororin is a master regulator of sister chromatid cohesion and separation. Cell Cycle. 2012;11(11):2073-2083.
- Nguyen MH, Koinuma J, Ueda K, et al. Phosphorylation and activation of cell division cycle associated 5 by mitogen-activated protein kinase play a crucial role in human lung carcinogenesis. Cancer Res. 2010;70(13):5337-5347.
- Shen Z, Yu X, Zheng Y, et al. CDCA5 regulates proliferation in hepatocellular carcinoma and has potential as a negative prognostic marker. Onco Targets Ther. 2018;11(1):891-901.
- Ding K, Li W Zou Z, Zou X, et al. CCNB1 is a prognostic biomarker for ER+ breast cancer. Med Hypotheses. 2014;83(3):359-364.
- Liu J, Liu Z, Zhang X, et al. Examination of the expression and prognostic significance of DLGAPs in gastric cancer using the TCGA database and bioinformatic analysis. Mol Med Rep. 2018;18(6):5621-5629.
- Wong J, Fang G. HURP controls spindle dynamics to promote proper interkinetochore tension and efficient kinetochore capture. J Cell Biol. 2006;173(6):879-891.
- Branchi V, García SA, Radhakrishnan P, et al. Prognostic value of DLGAP5 in colorectal cancer. Int J Colorectal Dis. 2019;34(8):1455-1465.
- Gomez CR, Kosari F, Munz JM, et al. Prognostic value of discs large homolog 7 transcript levels in prostate cancer. PLoS One. 2013;8(12):82833.
- Zhang Z, Chai C, Shen T, et al. Aberrant KIF20A expression is associated with adverse clinical outcome and promotes tumor progression in prostate cancer. Dis Markers. 2019;2019(1):4782730.
- Lu M, Huang X, Chen Y, et al. Aberrant KIF20A expression might independently predict poor overall survival and recurrence-free survival of hepatocellular carcinoma. IUBMB Life. 2018;70(4):328-335.
- Zhao X, Zhou LL, Li X, et al. Overexpression of KIF20A confers malignant phenotype of lung adenocarcinoma by promoting cell proliferation and inhibiting apoptosis. Cancer Med. 2018;7(9):4678-4689.
- Puchert M, Obst J, Koch C, et al. CXCL11 promotes tumor progression by the biased use of the chemokine receptors CXCR3 and CXCR7. Cytokine. 2020;125(1):154809.
- Li X, Zhong Q, Luo D, et al. The prognostic value of CXC subfamily ligands in stage I-III patients with colorectal cancer. PLoS One. 2019;14(4):0214611.
Google Scholar Cross Ref
- Razis E, Kalogeras KT, Kotsantis I, et al. The role of CXCL13 and CXCL9 in early breast cancer. Clin Breast Cancer. 2019;20(1):36-53.
- Marques P, Barry S, Carlsen E, et al. Chemokines modulate the tumour microenvironment in pituitary neuroendocrine tumours. Acta Neuropathol Commun. 2019;7(1):172.
Google Scholar Cross Ref
- Mousavi A. CXCL12/CXCR4 signal transduction in diseases and its molecular approaches in targeted-therapy. Immunol Lett. 2019;217(1):91-115.
- Yang P, Hu Y, Zhou Q. The CXCL12-CXCR4 signaling axis plays a key role in cancer metastasis and is a potential target for developing novel therapeutics against metastatic cancer. Curr Med Chem. 2020;27(33):5543-5561.
- Christopoulos PF, Msaouel P, Koutsilieris M. The role of the insulin-like growth factor-1 system in breast cancer. Mol Cancer. 2015;14(1):43.
- Fajka-Boja R, Marton A, Tóth A, et al. Increased insulin-like growth factor 1 production by polyploid adipose stem cells promotes growth of breast cancer cells. BMC Cancer. 2018;18(1):872.
Google Scholar Cross Ref
- Zou Y, Zheng S, Xiao W, et al. circRAD18 sponges miR-208a/3164 to promote triple-negative breast cancer progression through regulating IGF1 and FGF2 expression. Carcinogenesis. 2019;40(12):1469-1479.
- Qadir F, Lalli A, Dar HH, et al. Clinical correlation of opposing molecular signatures in head and neck squamous cell carcinoma. BMC Cancer. 2019;19(1):830.
- Waalkes S, Atschekzei F, Kramer MW, et al. Fibronectin 1 mRNA expression correlates with advanced disease in renal cancer. BMC Cancer. 2010;10(1):503.
- Song G, Liu K, Yang X, et al. SATB1 plays an oncogenic role in esophageal cancer by up-regulation of FN1 and PDGFRB. Oncotarget. 2017;8(11):17771-17784.
- Volanakis JE, Narayana SV. Complement factor D, a novel serine protease. Protein Sci. 1996;5(4):553-64.
- Xu Y, Narayana SV, Volanakis JE. Structural biology of the alternative pathway convertase. Immunol Rev. 2001;180(1):123-135.
- Claerhout S, Lim JY, Choi W, et al. Gene expression signature analysis identifies vorinostat as a candidate therapy for gastric cancer. PLoS One. 2011;6(9):24662.
- Ye H, Yu T, Temam S, et al. Transcriptomic dissection of tongue squamous cell carcinoma. BMC Genomics. 2008;9(1):69.


