


Managing re-investment risk
Received: 21-Oct-2024, Manuscript No. puljpam-24-7289; Editor assigned: 23-Oct-2024, Pre QC No. puljpam-24-7289(PQ); Accepted Date: Nov 20, 2024; Reviewed: 27-Oct-2024 QC No. puljpam-24-7289(Q); Revised: 31-Oct-2024, Manuscript No. puljpam-24-7289(R); Published: 30-Nov-2024, DOI: 10.37532/2752- 8081.24.8(5).01-04
Citation: Frischemeier S. Managing Re-Investment risk. J pure appl math. 2024;8(5):1-4
This open-access article is distributed under the terms of the Creative Commons Attribution Non-Commercial License (CC BY-NC) (http://creativecommons.org/licenses/by-nc/4.0/), which permits reuse, distribution and reproduction of the article, provided that the original work is properly cited and the reuse is restricted to noncommercial purposes. For commercial reuse, contact reprints@pulsus.com
Abstract
Insurance contracts, especially from business lines life and health, are of economic nature, obviously by their usual term and real hedging claim. It is impossible to replicate the complete claim at capital markets ex-ante. In contrast to pure wealth management products, customers purchase and claim a dedicated economic benefit, they at least redeem when the insured event occurs.
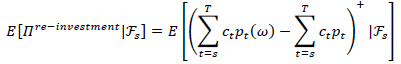
This essay is primarily devoted to the formulation of an option-price for economic re-investment risk, which is undertaken in the economic horizon behind the so-called last liquid point (llp). Under, for financial mathematic models, common assumptions, risk can be measured by the formula

Where c stands for aggregate contractual cash-flow, p for stochastic or expected price of the risk-free economy yield-curve, with term exceeding the llp, and Ω for the state-space.
The claim and yield-curve replicating portfolio hedges economic welfare, its inflation and real growth rate. In the qualitative component it preserves and improves customers’ level of sectorial economic welfare through risk-adjusted investment. In the quantitative component it collects the aggregate cost of capital margin for related economic welfare in prices consumers pay.
Secondarily the article wants to find answers for arising questions: What does financially rational surplus participation under the regime of the option price formula for re-investment risk look like? What is the formula’s advantage over entity simulations common under Solvency II? Is steering re-investment risk part of enterprise risk management or product component in form of a margin? How to deal with discretionary participation, as considered under IFRS 17, regarding the formula? What is the best choice for the interest rate model generating stochastic prices? Finally, again: What is the correct yield curve?
Key Words
Economic welfare; Stochastic prices; Financial mathematic models; Investment risk.
Introduction
The option-price formula for economic re-investment risk
Proving the formula is straight forward, especially in time-discreet notation. Let (Ω,â?±,P) be a filtered utility space. Under common assumptions for financial mathematic stochastic models, the homo economicus replicates contractual cash flows (ct)t≤llp risk free atprices (pt)t≤llp up to terms lower or equal the last liquid point. Thispart can be dissolved out of the framework since no stochasticity arises. We only have to reconsider it when determining the nature of the risk-free asset [1-5].
Terms exceeding the last liquid point cannot be bought at deep, liquid and transparent (dlt) markets ex-ante and thus are stochastic assets from future dlt markets. We note ω =(ωt)LLP
Proof is path wise obtained by the principal of backward induction:
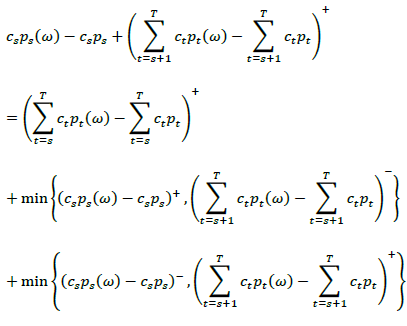
Which is πreinvestment(ω, s, t) plus the loss absorbing capacity of the path itself. Taking expectation over the term we get
Extending this induction down to we obtain the assertion. For bounded maturity and llp the argument easily holds in continuous time, which is not really mandatory in the time-discreet world of insurance cash flows.
The replicating portfolio – Economic contingent claim
Replicating the economic insurance claim exceeds the simple assumption, that there exists a risk-free asset in the market. We have to verify the continuum of markets which include a risk-free asset over the whole contractual period. Furthermore, insurance includes qualitative claims of purchasing power and level of welfare. It is up to the insurer to evaluate these micro-economic factors in the context of macro-economic growth rates to generate reliability.
At first, real hedging is restricted to the contractual relation. Key task is preserving sectorial purchasing power and a well-defined partial level of welfare. Methods of biometric or loss prevention may have significant impact on yield optimization problems in investment, as well as moral guidelines.
The counterparty of the insurance contract is thus defined by her normal and conditional consumer behavior. By formally correct links to investment sectors we may apply an exclusion principle: As long as the contract exists, as long the counterparty consumes, default of the counterparty on the asset side is impossible – corresponding investment markets exist continuously until maturity. Additional by contraposition we can show that this investment strategy is risk-free and optimal.
First step is made by determining proper portfolio weights for basic and conditional consumption baskets based on actuarial statistics. Methods of biometric or loss prevention can be placed in basic consumption basket investment, which aims to preserve purchasing power. Funding the conditional consumption basket supports the quality of insurance benefits and skims yields from the sector, which would be lost to third parties for both insurance and customer elsewise. Subsequent we only discuss one common consumption basket.
Consumption statistics can be obtained from government institutions, investment targets of retail and trade sectors and directly, possibly automatized, through customer survey. The consumption basket is a time- and market- depending derivative of utility-functions, substitution-rates and budget-restrictions. By analysis of the consumption-dynamics, implicit utility-functions, substitution-rates and budget-restriction can be deduced. This deep customer knowledge supports portfolio stability. We get to know, how customers re-allocate their consumption during crises and which products quickly increase in utility.
In a thorough investment assessment, producers, supply chains and commodities corresponding to the consumption basket are determined. This knowledge forms the second building block of insurance in investment, as it provides deep comprehension of consumer economics operations. We have to mention, that state services are considered under consumption here as well.
Investment consequently follows utility-induced weights of products in the consumption basket and underlying supply chains. Since equilibrium of the insurance market is given by the fact that the contract is bought by the customer and equilibrium of the product market restricted to defined level of welfare is achieved by bid-ask-management between producers and customers we are left with providing investment market equilibrium restricted to defined level of welfare. It is optimized by the natural risk assessment process of diversification in consumption. Additional risk-management like optimizing robustness of supply chains is possible within equilibria states.
Our obtained portfolio describes a growth path of consumption. From growth theory we obtain, that thus the portfolio converges continuously towards its steady state, if it is free to do so. We especially learn, that it is not necessary to purchase ultra-long durations. It is up to the insurer to evaluate the path under aspects of macro-theory and in comparison, with other global economic dynamics. Especially one question is crucial: Are customers’ implicit budget restraints capable of adjusting premiums to inflation?
The portfolio is capable of paying a compensation rate for inflation: Assumed that one investment target would be substituted when it’s price increases. That would be measured in our statistics and thus investment would be re-allocated.
The portfolio is also capable of paying a real growth rate: On the basis of our consumption statistics, we find trends in optimizing the sectorial level of welfare. An allocation exploiting this dynamic not only provides the necessary flow of capital but is rewarded with a yield from real growth.
As it captures the whole equilibrate consumption economy relevant for the customer our portfolio is risk-free per definition restricted to the contractual focus. Via macro-economic overlay management in reconciliation with global peers we shield investments, especially with respect to the complete markets condition, against exogenous effects that lay out of focus of the contractual relation.
We are left with proving optimality. For that we assume the following decomposition of consumption goods’ prices:
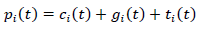
Where c stands for production costs, g for the profit margin and t for taxes. According to the principles of local accounting standards g can be transferred through the balance sheet or investment outline into cost of capital. But cost of capital is skimmed by the insurance undertaking’s investment activity in equilibrium aiming to avoid third party leaks.
Suppose now, the insurance corporation would invest into other targets out of the described focus. Then it would have to prove, that simultaneously a third party invests the same amount in our portfolio, so our mandate to preserve utility and welfare is not temporarily affected. Furthermore, it would have to give proof of a purchasing power swap at end of term which fulfills valid conditions on purchasing power and welfare then. The emerging afford would impair the performance towards direct investment into customers’ consumption basket.
From the scientifically and statistically founded focus on utility maximization we may obtain an outperformance of yield curves which represent broader averages of investments.
Surplus participation
Substantial difference towards existing forms of surplus participation consists in prospective measuring of re-investment risk over the remaining contractual period or aggregate liability duration of the entity.
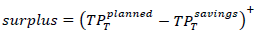
The disbursement is obtained from a statement of changes:
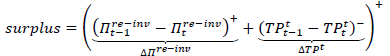
Where TP stands for current value of technical provisions.
Surplus arises from decreasing re-investment risk and a non-increase in expected technical provisions, which releases planned risk capital if dedicated to the customer. If re-investment risk or technical provisions increase towards the planned time value trajectory, no surpluses are distributed – as long as risk or technical provisions fall back under the ex-ante planned level.
But let us think about another variant of participation which requires less effort in administration. It is obvious, that the obtained investment portfolio can be managed as virtual or true investment fund. That has to be done anyway to provide the entity with transparent information. It additionally provides us with reconciliation of so-called savings premiums to their investment performance. Now it’s not a great deal to provide customers with current values of their savings and consumption of reserved risk capital for re-investment. The aggregate time value of risk-capital left and savings amount exceeding the contractual planned minimum yield can be interpreted as market consistent terminal bonus fund. Customers will additional to the earlier discussed advantages of an insurance product be granted the opportunity to take decision over their contract by principles of transparent wealth management. At the end of constructional period the insurance property bills total performance of savings and floors them with the minimum yield:
As a consequence, the insurance corporation is endowed with a higher degree of freedom and risk-bearing capacity, because it can continuously and without prudential justification burden the terminal surplus fund. Customers on the other hand are endowed with transparent information to take decision. Resulting from market expectations and the especial save portfolio strategy, surpluses stay highly probable (Figure 1).

Figure 1: The especial save portfolio strategy, surpluses stay highly probable
Solvency II – advantages over common entity-simulations
Since Solvency II was introduced to the European insurance industry, entity simulations became common in estimating the time value of technical provisions. Two of their disadvantages are apparent: The models are not financially rational in the sense of perfect decisions in alignment with the homo economicus principle and they are opaque resulting from their lack in unbundling components. In contrast, the option price formula for re-investment risk allows a step back into the transparent world of expected cash flow-vectors additionally endowed with a compactly capsuled stochastic building block.
Interactions with further significant underlying, as example given biometry or lapse, are taken into several stress scenarios, following the linear correlation approach of the standard formula. This avoids conflicts between modelled non-linear interaction and linear aggregation.
Enterprise risk-management or product margin?
Taking a closer look at classic insurance contracts, one finds that they are highly approximate in many ways. We already pointed out, that currently the time value of savings premiums is not visible like in the form of purchased fund shares. Furthermore, the dependence of re-investment risk on the contractual period is not considered. One contract with term twelve years containing no re-investment risk is commonly restricted by the same interest rate ceiling as one contract with maturity in thirty years and significant re-investment risk.
From the martingale property and the assumption of strictly positive cash flow aggregates in the horizon behind the last liquid point we obtain:
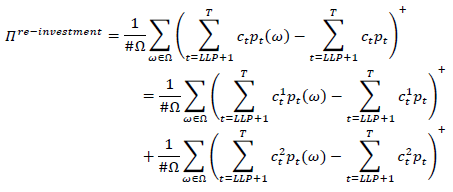
Consequently, from the mathematically point of view it does not matter if risk controlling of re-investment is part of enterprise risk management or part of the product in the form of a margin.
Relevant are criteria of fairness that are summarized in the principle of fair value.
Re-investment risk in the context of IFRS 17
The International Accounting Standard for Insurance Contracts (IFRS 17) suggests discretionary surplus participation features, which may legally fit previous generations of classic contracts. An unsolved problem remains regarding capital flows through the replicating asset side from one contractual yield-generation to another. Two customers with an equal savings amount in one balance year obtain different rewards and no one knows where these come from. Thus, the corporation may be accused of using customers’ saving amounts to repair mistakes in yield forecasting. Compared with financial service providers that undertake short durations and replicate them instantaneously at capital markets, this argument has special relevance for long duration insurance contracts. Under classic insurance contracts whole life time exploitive relationships may be established in worst case.
Such an exploitive relationship is avoided, by taking the risk capital necessary to manage defined quantiles of re-investment risk into an isolated product-margin. Occurring losses will be paid exclusively from the margin and in border quantiles from equity then. Thus, maximal fairness is guaranteed and taken into accounts.
Especially the inclusion of a margin computed by the option price formula allows avoiding simulations based on national accounting standards and focus on financially rational pricing of expected future cash flows. This rewards us with a high degree in neutrality.
Choice of a proper interest rate model and calibration
From the construction of the replicating portfolio it is clear, that the aggregate dynamic of a portfolio share is driven by countably bounded many sub-price-dynamics. Furthermore, the interval of projections starts where current knowledge about implied volatilities from deep, liquid transparent markets comes to an end. Consequently, choice has to be made in the group of short-rate models, which perfectly describe aggregates of sub-dynamics as result of their infinitesimal virtual character and do not lead us into conflicts arising from lacks in valid long-term market data.
We pointed out that it is our key-target to avoid economic divergence by investment allocation. Based on the portfolio construction we expect to obtain inflation- and real- rates following a bounded distribution corridor with highest probability possible. Consequently, we have to take a short-rate model including a mean-reversion property which guaranties long-term non-diverging yields.
The calibration task consists of fitting the model to the base curve and parameters for mean-reversion and short-rate volatility to the expected economic distribution corridor. Parameters can only be fitted on the basis of appropriate historic data and its trend, because implicit information from traded options out of deep, liquid and transparent markets is not available in the economic horizon behind the last liquid point. Thus, parameters have to be adjusted in a way that generated yield path fit trend distributions of consumption data approximately. Keeping in mind, that it is not absolutely necessary to compute precisely what is not exact but to manage obtained risk capital properly.
Once again-the yield curve
Globalization has been a significant heading when it came to economic development in the past. Now we observe a shift towards sustainability. Regulators stipulate national numéraires regarding evaluation of insurance contracts. We obtain from thorough research that consumption economy is key driver of insurance liability. On behalf of customer-relation it is essential for the insurance corporation to preserve utility induced level of welfare. Therefore, special attention is paid to the alignment of national economic rates and consumer economic prices. Insights might be used for investing into a broader diversified national consume production or strengthening foreign supply chain relations. In the role of a welfare manager the insurance undertaking becomes valuable contact for national governments regarding government investments and external trade balances.
References
- Stochastic Finance, Hans Föllmer, Alexander Schied, Walter de Gruyter
- Arbitrage Theory in Continuous Time, Thomas Björk, Oxford Finance
- Interest Rate Models – Theoy and Practice: With Smile, Inflation and Credit, Damiano Brigo, Fabio Mercurio, Springer Finance
- Micro-Economy, Robert S. Pindyck, Daniel L. Rubinfeld, Pearson
- Macroeconomic Theory, Volker Böhm, Springer