Microwave Synthesis of Perovskite Based High Surface Area srTio3 Nanoparticles: Application for Adsorption of Congo Red Dye in Water
Received: 06-Jun-2018 Accepted Date: Jun 07, 2018; Published: 07-Jul-2018
Citation: Srilakshmi Ch. Microwave Synthesis of Perovskite Based High Surface Area srTio3 Nanoparticles: Application for Adsorption of Congo Red Dye in Water. Nano Lett. 2018;2(1):10.
This open-access article is distributed under the terms of the Creative Commons Attribution Non-Commercial License (CC BY-NC) (http://creativecommons.org/licenses/by-nc/4.0/), which permits reuse, distribution and reproduction of the article, provided that the original work is properly cited and the reuse is restricted to noncommercial purposes. For commercial reuse, contact reprints@pulsus.com
Abstract
In the present study, we have synthesized successfully pure cubic phase of SrTiO3 (STO) Nano adsorbent using microwave assisted hydrothermal method and applied for the adsorptive removal of Congo red dye from water without adjusting any external parameters such as pH and temperature of adsorption. The physico-chemical properties of the adsorbent have been investigated using various analytical methods such as powder X-ray diffraction (XRD), Fourier transform infrared (FT-IR) spectroscopy, Transmission electron microscopy (TEM), UV-Visible spectroscopy and BET surface area by N2 physisorption. High adsorption capacity of the STO Nano adsorbent was due to high surface area and mesoporosity of the adsorbent. Adsorption kinetic data fitted well with the pseudo second order kinetic model with correlation coefficients ranging from 0.992 to 0.999 and equilibrium adsorption isotherms was found to best fit to the Langmuir adsorption isotherm model.
Keywords
SrTiO3 nanoadsorbent; Microwave; Hydrothermal; synthesis; Dye adsorption; Kinetics; Isotherms.
Introduction
Industrial liquid discharge from textile, paper, cosmetics, plastic and pharmaceutical industries [1] contain toxic compounds in water contributes to environmental pollution and pose great threat to aquatic animals as it increases chemical oxygen demand (COD) and delaying the growth of microorganisms by reducing the light penetration and visibility [2,3]. Most of the dyes are stable and carcinogenic and mutagenic when exposed to cause severe health problems to humans and aquatic organisms [4]. Various methods of treatment is conventionally employed to treat the wastewater such as coagulation [5], oxidation [6], photo catalysis [7], adsorption [8], Nano filtration [9] and micellar enhanced ultrafiltration [10] etc. Among these methods adsorption is a superior compared to others due it is simple, highly efficient, eco-friendly, and easy recovery and reusability.
Among various dyes, it is challenging to remove anionic dyes as they are bright in color, dissolve in water and acidic in nature [11]. Example of an anionic dye is Congo red (CR) (sodium salt of benzedinediazobis-1- naphthylamine-4-sulfonic acid) is one of the most frequently used secondary diazo dye and benzidine is a toxic metabolite of CR, which causes cancer in humans [12]. Even low concentration of CR affects the aquatic life, and thus, the food web. The structure of the CR is very stable, and it is very difficult to remove from the aqueous solution and hence, persisting in the environment. So, there is a strong need for the design and development of an efficient adsorbent which can completely remove the dye from water.
Various adsorbents such as activated carbon, clays, polymeric materials [13], rice husk [14], seed coat [15] and mycelial biomass [16] previously reported for the removal CR dye from wastewater. However, due to low adsorption capacity and reusability problems along high cost of operation prevent these adsorbents from large-scale application in wastewater treatment. In the present study, we have employed microwave synthesized SrTiO3 (STO) Nanoadsorbent for the first time for the adsorption of CR dye from water.
STO is an important perovskite oxide, with high stability and has been used in many applications such as water splitting under UV light irradiation [17], electrical applications [18], as a photocatalyst due to its band gap 3.2eV [19], superconductor [20], luminescence [21] and in solid oxide fuel cells [22].
STO has been synthesized by using various methods such as coprecipitation [23], solid-state reaction [24], liquid-solid reaction method [25], molten salt synthesis [26] sol-gel and hydrothermal method [27]. All these methods involve mixing of the salt solutions, aging and treatment at high temperatures for longer times. The above methods require longer preparation times and high amounts of energy. The phase purity of the above methods is another concern. In the present study, we have synthesized high surface area STO nanoparticles for the first time by using microwave assisted hydrothermal method. Synthesis of materials using microwave irradiation is emerging as a viable alternative green chemistry, which provides the industry with a more sustainable method in the future [28-30]. In microwave irradiation, homogeneous and fast heating would lead to a rapid and uniform growth of the particles.
This paper describes a procedure for a rapid microwave assistedhydrothermal synthesis of SrTiO3 Nano adsorbent. The effects of various parameters (initial CR dye concentration, amount of adsorbent and contact time) on the dye removal capacity of the synthesized Nano SrTiO3 have been investigated. Adsorption kinetic models and adsorption isotherm models were also studied to understand the adsorption mechanism.
Experimental Details
Microwave synthesis of STO nanoadsorbent
STO Nano adsorbent was synthesized by using microwave assisted hydrothermal method reported by our group [31]. To synthesize SrTiO3, SrCl2. 2H2O and TiCl4 were chosen as precursor materials. In a typical synthesis, TiCl4 was added to the distilled water at 0°C and mixed with aqueous SrCl2 while continuously stirring with magnetic stirrer. To this solution, aqueous KOH was added slowly with vigorous stirring for 1 h. The molar ratio of TiCl4: SrCl2. 2H2O: KOH: H2O maintained at 1: 2: 30: 300. The resultant mixture was transferred into 1000 mL Teflon-lined autoclave, sealed and placed in microwave instrument at 180°C for 30 min (Model: MW 5000, SINEO, maximum power: 1500W). After the reaction, the autoclave was allowed to cool down to room temperature and filtered the precipitate. The precipitate thus obtained was thoroughly washed with 0.1 M aqueous acetic acid solution and deionized water. The final product was dried in hot air oven at 105°C for 12 h.
Characterization of the nanoadsorbent
Powder X-ray diffraction (XRD) pattern of the synthesized sample was recorded using PAN analytical X’pert PRO Powder Diffractometer equipped with Cu Kα (λ=0.15418 nm) as the radiation source. The XRD pattern was recorded in the 2θ ranges 10-80°C with a scanning speed of 3°C /min. BET surface area was determined on a Micromeritics (Auto Chem-2910) instrument with nitrogen physisorption at 77 K, taking 0.169 nm2 as the cross-sectional area of dinitrogen. STO was initially pre-treated by purging nitrogen gas at 300°C for 4 h. Morphology and particle size of the synthesized STO was analysed by using high resolution transmission electron micrograph (HRTEM), obtained from transmission electron microscope (Model JEM-2010, JEOL, Tokyo, Japan). Energy dispersive X-ray spectroscopy (EDS) was carried out using EDAX system attached to HRTEM.
Adsorption studies
The adsorption experiments were carried out in batch mode at room temperature. In a typical batch adsorption experiment, the desired amount of STO Nano adsorbent was added to 100 ml of the CR dye solution in a 250 ml beaker. To determine the remaining CR dye concentration in the solution, the Nano adsorbent was separated by centrifugation at 10000 rpm for 10 min and the solutions were analyzed using the PerkinElmer (Lambda 750) UV-Vis spectrophotometer at a maximum wavelength of 497 nm. The amount of dye adsorbed on the adsorbent surface, qe (mg g-1), was calculated using the following equation (1):
 (1)
(1)
where C0 and Ce are the initial and equilibrium concentrations of CR dye solution (mg L-1) respectively, V is the volume of solution (L) and m is mass of the STO nanoadsorbent (g).
The calibration curve was constructed with standard CR dye solutions (concentrations: 0-100 mg L-1). To study the adsorption kinetic studies, 2-3 ml of the dye solution was collected at desired time intervals by keeping the dye concentration and adsorbent dose as constant. Effect of initial concentration of CR dye on adsorption capacity was studied with initial CR concentrations ranging from 50 mg L-1 to 500 mg L-1.
Result and Discussion
X-ray diffraction analysis
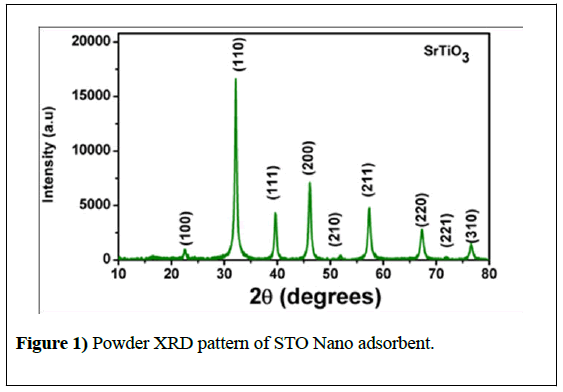
The diffraction pattern of STO nanoadsorbent is shown in Figure 1 XRD pattern was indexed to pure STO cubic perovskite structure with Pm-3m (No. 221) space group (JCPDS card no. 073-0661). No peaks corresponding to impurities such as TiO2 and SrCO3 are present in the XRD of STO nano adsorbent.
Average crystallite size (D) of the catalyst powders was determined using Scherrer equation 2 as followed:
 (2)
(2)
Where λ is the X-ray wavelength (1.5418Å), β is the full width at half maximum (FWHM) and θ is the Bragg angle. The average crystallite size evaluated from the XRD pattern was found to be 37.4nm. The smaller crystallite size of the adsorbent could be due to the microwave heating effect where dipolechange of the polar molecules with uniform temperature distribution leading to molecular agitation and friction which gradually reduces the size of the particle.
FT-IR spectroscopy
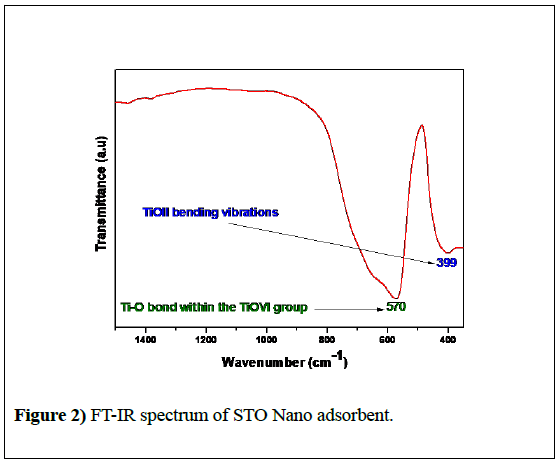
The FT-IR spectrum of STO Nano adsorbent measured at room temperature from 360 to 1500 cm-1 is shown in Figure 2. A broad absorption band observed in the range of 500-800 cm−1 corresponds to the vibrations of the Ti-O bond within the TiOVI group [31] and the weak band appeared at 399 cm-1 was due to the TiOII bending vibration.
Transmission electron microscopy
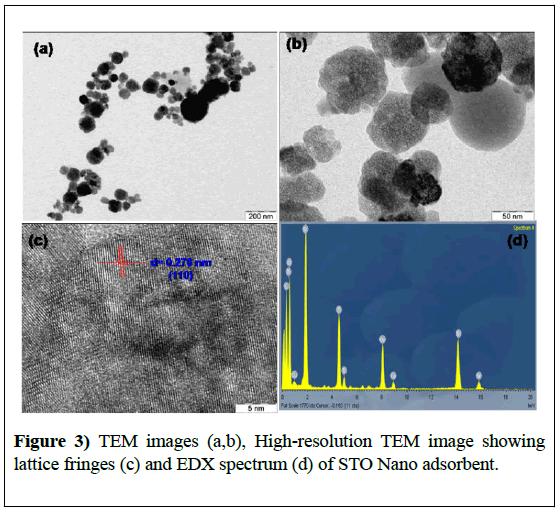
Morphology and particle size of the STO was studied using transmission electron microscopy and the images are displayed in Figure 3. It was observed that STO is highly porous with clearly visible pores consists of highly dispersed cubic and spherical particles with an average particle size of 21.4 nm.
The smaller particle size of STO adsorbent was due to cavitation effect that caused during microwave heating which has been discussed in our paper [31]. HRTEM image of the nanoadsorbent showed clear lattice fringes as shown in Figure 3c and the interlayer spacing calculated is found to be 0.276 nm corresponds to the (110) crystal plane spacing of cubic SrTiO3 (JCPDS card no. 073-0661, d110=0.276 nm). Energy dispersive X-ray analysis (EDX) of STO confirmed the presence of Sr, Ti and O elements in STO nano adsorbent (Figure 3).
BET surface area by N2 physisorption
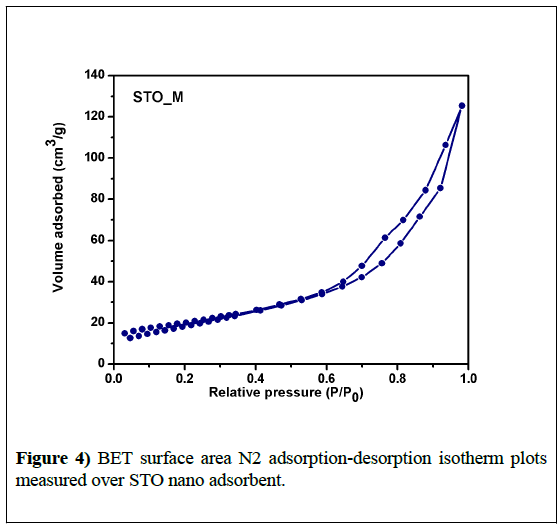
The adsorption is strongly influenced by the surface properties of the adsorbent such as nature and surface area. Surface properties of the synthesized STO Nano adsorbent were analysed by N2 adsorptiondesorption isotherms and are shown in Figure 4. STO_M showed a Type IV isotherm which is a characteristic of mesoporous materials together with a Type H3 hysteresis loop in the range 0.7 to 0.9 P/P0. Textural properties, such as the specific surface area, pore volume, and pore size of the STO Nano adsorbent are summarized in Table 3. The pore size of the STO nanoadsorbent was found to be 9.6 nm which is greater than 2 nm and hence confirms the presence of mesopores in the adsorbent.
We have varied the adsorbent dose from 0.5 g L-1 to 2.5 g L-1 in contact with 100 mL of 100 mg L-1 CR dye solution and found that 2.0 g L-1 is the optimum dosage to attain maximum adsorption capacity beyond which adsorption remains constant. Hence, we have kept adsorbent dose as constant at 2.0 g L-1 for further studies.
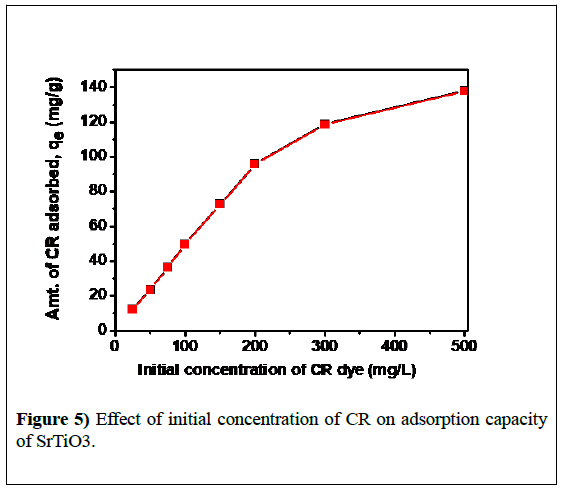
The effect of initial concentration of CR on the adsorption capacity of STO was studied by keeping the adsorbent dose constant as (2 g L-1) and was shown in Figure 5. It was observed that, with the increase in dye concentration (C0), dye adsorption capacity (qe) of the adsorbent increases and then reaches a plateau. This was due to saturation of adsorption sites and or repulsive forces between the CR adsorbed on the surface and solution phase at higher concentrations. High surface area and mesoporosity of STO Nano adsorbent contribute towards its higher adsorption capacity. A closer look at these results infers that maximum amount of CR dye adsorption on STO was 137 mg g-1 which was achieved at 500 mg L-1 dye concentration.
Effect of adsorbent dosage and initial CR dye concentration
We have varied the adsorbent dose from 0.5 g L-1 to 2.5 g L-1 in contact with 100 mL of 100 mg L-1 CR dye solution and found that 2.0 g L-1 is the optimum dosage to attain maximum adsorption capacity beyond which adsorption remains constant. Hence, we have kept adsorbent dose as constant at 2.0 g L-1 for further studies.
The effect of initial concentration of CR on the adsorption capacity of STO was studied by keeping the adsorbent dose constant as (2 g L-1) and was shown in Figure 5. It was observed that, with the increase in dye concentration (C0), dye adsorption capacity (qe) of the adsorbent increases and then reaches a plateau. This was due to saturation of adsorption sites and or repulsive forces between the CR adsorbed on the surface and solution phase at higher concentrations.
High surface area and mesoporosity of STO Nano adsorbent contribute towards its higher adsorption capacity. A closer look at these results infers that maximum amount of CR dye adsorption on STO was 137 mg g-1 which was achieved at 500 mg L-1 dye concentration.
Adsorption kinetics
To study the kinetics of CR dye adsorption on STO adsorbent, Lagergren pseudo-first-order kinetic model and Ho’s pseudo-second-order kinetic models were employed to the experimental data sets.
Pseudo first order model
The Lagergren pseudo-first-order kinetic model [32] is expressed as:
 (3)
(3)
when qt=0 at t=0, Equation (3) can be integrated into following equation:
 (4)
(4)
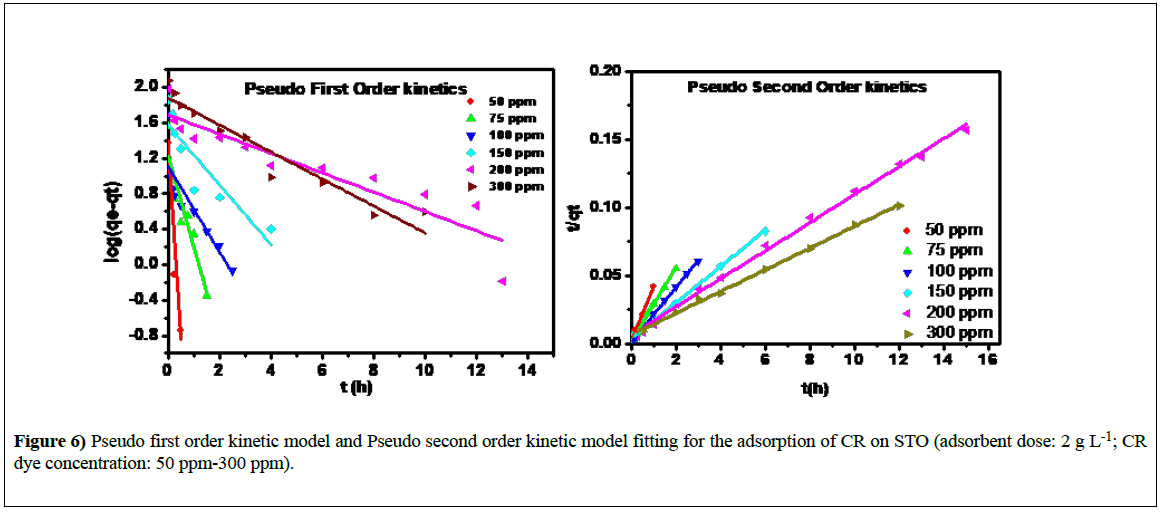
Where qt is the amount of CR dye adsorbed per unit of STO adsorbent (mg g−1) at time t, k1 is the pseudo-first order rate constant (h−1), and t is the contact time (h). Figure 6 shows the pseudo-first-order kinetic data for the adsorption of 50-300 ppm concentration of CR onto STO adsorbent. The R2 value is not very high and is between 0.7355 and 0.9179.
The adsorption rate constant (k1) and qe were calculated from the plot of log (qe-qt) against t and are presented in Table 1. As can be seen from Table 1, with increasing concentration from 50 to 300 ppm, the rate constant of pseudo-first-order k1, decreases from 10.12 to 0.350 h-1 and the values of qe were increased steadily.
| Pseudo first order | Pseudo second order | ||||||
|---|---|---|---|---|---|---|---|
| C0 (ppm) | qe-exp | qe | k1 | R2 | k2 | qe | R2 |
| 50 | 23.82 | 22.64 | 10.12 | 0.905 | 1.02 | 24.8 | 0.991 |
| 75 | 36.27 | 16.7 | 2.36 | 0.85 | 0.61 | 36.61 | 0.998 |
| 100 | 49.68 | 12.82 | 1.11 | 0.735 | 0.42 | 49.75 | 0.999 |
| 150 | 72.68 | 37.39 | 0.77 | 0.768 | 0.05 | 75.35 | 0.998 |
| 200 | 95.75 | 49.07 | 0.25 | 0.838 | 0.01 | 97.08 | 0.996 |
| 300 | 118.62 | 76.09 | 0.35 | 0.917 | 0.009 | 125.47 | 0.998 |
Table 1: Parameters obtained from pseudo-first-order and pseudo-second-order kinetic models for CR dye adsorption on STO
Pseudo-second order model
Ho and McKay [33,34] presented the pseudo-second-order kinetic model as:
 (5)
(5)
Integrating Equation 5 and noting that qt=0 at t=0, the obtained equation can be rearranged into a linear form:
 (6)
(6)
where k2 is the pseudo-second-order rate constant (g mg−1 h−1). The plots of the linearized form of the pseudo-second-order kinetic model for the adsorption of CR onto STO adsorbent is shown in Figure 6. The values of qe and k2 were estimated from the slope and intercept of plots of t/qt versus t and the corresponding results are also presented in Table 1. The correlation coefficients are much greater for pseudo-second-order model, and are in the range of 0.9914-0.9992, confirming good agreement with experimental data sets.
Furthermore, R2 values obtained for pseudo-second-order kinetic model are higher than pseudo-first-order model. The results revealed that the CR adsorption on STO proceeds via a pseudo-second-order kinetic rather than a pseudo-first-order kinetic mechanism. The best fit to the pseudo-secondorder kinetics indicates that the adsorption mechanism depends on both the adsorbate and the adsorbent.
Adsorption isotherms
Equilibrium adsorption studies determine the capacity of the adsorbent and describe the adsorption isotherm with constants whose values reveals the surface properties and interaction between adsorbate and adsorbent. The adsorption isotherm data was fitted by using Langmuir and Freundlich models. The parameters obtained from the two models provide important information on the sorption mechanism and the surface property and affinity of the adsorbent.
Langmuir isotherm model
The Langmuir adsorption isotherm model is based on the monolayer coverage of the adsorbent at specific homogeneous sites having equivalent sorption energies with no interaction between adsorption sites. The linear form of the Langmuir isotherm model is represented as follows [35]:
 (7)
(7)
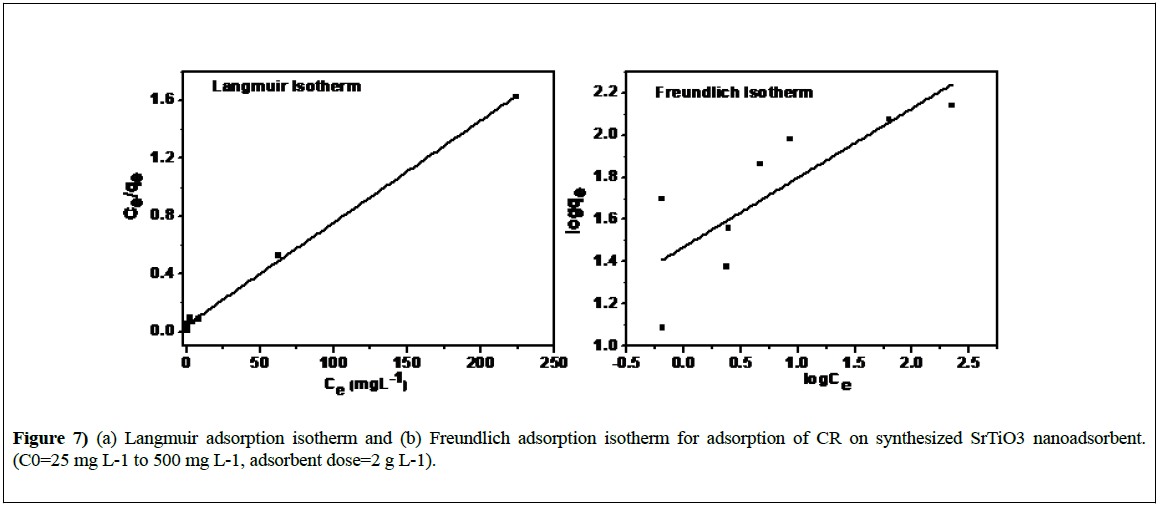
where, Ce (mg L-1), qe (mg g-1) and qm (mg g-1) are the concentration of CR dye at equilibrium time, quantity of CR adsorbed per gram of adsorbent at equilibrium and monolayer adsorption capacity respectively; b is the Langmuir constant associated with the energy of absorption. Figure 7 shows the plot of Ce/qe versus 1/qe for the Langmuir isotherm for STO adsorbent. Its slope and intercept give the values of b and qm which are presented in Table 2. The correlation coefficient (R2) obtained was 0.9974 reveals the best fit to the data.
| Langmuir | Freundlich | ||||
|---|---|---|---|---|---|
| qm(mg/g) | b | R2 | KF | 1/n | R2 |
| 141.04 | 0.15 | 0.997 | 29.54 | 0.328 | 0.602 |
Table 2: Adsorption isotherm constants and correlation coefficients for Langmuir and Freundlich isotherm models
| Adsorbent | BET Surface area (m2/g) | Pore volume (cc/g) | Pore diameter (nm) | TEM particle size | XRD Crystallite size (nm) |
|---|---|---|---|---|---|
| (nm) | |||||
| STO | 69.01 | 0.16 | 9.6 | 21.4 | 37.4 |
Table 3: BET surface area, pore volume and pore diameter of the STO Nano adsorbent from N2 adsorption-desorption studies and particle size from TEM and XRD data
Freundlich isotherm model
The Freundlich isotherm [36] is an empirical equation based on an exponential distribution of adsorption sites and energies and is represented as:
 (8)
(8)
Its linear form by taking logarithms is:
 (9)
(9)
where Ce is the concentration of CR dye solution at equilibrium (mg L-1), qe is the amount of adsorbate (CR dye) adsorbed per gram of adsorbent at equilibrium (mg g-1), KF (l mg-1) and n are the constants, indicates the adsorption capacity and the degree of nonlinearity between solution concentration and adsorption, respectively. ‘n’ is a measure of the deviation from linearity of the adsorption and used to verify types of adsorption. It is suggested that if n=1, the adsorption is linear, whereas if n<1, the adsorption is a chemical process and n>1 indicates a favorable adsorption and a physical process.
Figure 7 represent the plot of the experimental data based on Freundlich isotherm model. KF and 1/n values can be calculated from intercept and slope of the linear plot between log Ce and log qe. The parameters KF and n of the Freundlich isotherm are listed in Table 2. From the Figure 7 it can be seen that the much lower value of correlation coefficient (R2) i.e. 0.6022 reveals that the adsorption is not a multilayer phenomenon on STO.
Conclusion
SrTiO3 nanoadsorbent was synthesized successfully using microwave assisted hydrothermal green method. Using the method described the pure cubic phase of STO was formed with an average crystallite size of 37.4 nm. BET surface area of the adsorbent was found to be 69 m2/g with a pore diameter of 9.6 nm which indicates mesoporous nature of the adsorbent. Particle size calculated using TEM image analysis was found to be 21.4 nm. Adsorption studies for CR were conducted at room temperature without adjusting any pH of the solution in order to enhance the adsorption. The adsorption capacity of the STO adsorbent for 50-300 ppm CR dye concentrations was found to be in the range of 23 to 118 m2/g respectively. Adsorption kinetics data obeyed pseudo-second-order kinetic model with correlation coefficients in the range of 0.992 to 0.999. The best fit to the pseudo-second-order model indicates adsorption mechanism on STO depends both on adsorbate and adsorbent.
Equilibrium adsorption data followed the Langmuir Isotherm model which indicates the monolayer adsorption.
Acknowledgement
CHSL Wishes to thank Department of Science and Technology (DST) For Financial Support.
REFERENCES
- Li Zhou, Chao Gao, Weijian Xu. Magnetic Dendritic Materials for Highly Efficient Adsorption of Dyes and Drugs, Appl. Mater. Interfaces. 2010;2:1483-91.
- Forgacs E, Cserhati T, Oros G. Removal of synthetic dyes from waste waters: a review. Environ Int. 2004;30:953-971.
- Singh A, Dutta DP, Ramkumar J, et al. Serendipitous discovery of super adsorbent properties of sonochemically synthesized nano BaWO4. RSC Adv. 2013;3:22580-90.
- Vautier C, Guillard, Herrmann JM. Photocatalytic Degradation of Dyes in Water: Case Study of Indigo and of Indigo Carmine. J Catal. 2001;201:46-59.
- Chafi M, Gourich B, Essadki AH, et al. Comparison of electrocoagulation using iron and aluminium electrodes with chemical coagulation for the removal of a highly soluble acid dye. Desalination. 2011;281:285-92.
- Osugi ME, Rajeshwar K, Ferraz ERA, et al. Comparison of oxidation efficiency of disperse dyes by chemical and photoelectrocatalytic chlorination and removal of mutagenic activity. Electrochim Acta. 2009;54:2086-093.
- Liu S, Cai Y, Cai X, et al. Catalytic photodegradation of Congo red in aqueous solution by Ln(OH)3 (Ln=Nd, Sm, Eu, Gd, Tb, and Dy) nanorods. Appl Catal A Chem. 2013;453:45-53.
- Zhou J, Tang C, Cheng B, et al. Rattle-type Carbon–Alumina Core–Shell Spheres: Synthesis and Application for Adsorption of Organic Dyes. ACS Appl Mater Interfaces. 2012;4:2174-79.
- Chakraborty S, Purkait MK, Dasgupta S, et al. Nanofiltration of textile plant effluent for color removal and reduction in COD. Sep Purif Technol. 2003;31:141-151.
- Purkait MK, Dasgupta S, De S. Removal of dye from wastewater using micellar-enhanced ultrafiltration and recovery of surfactant. Sep Purif Technol. 2004;7:81-92.
- Gharbani P, Tabatabaii SM, Mehrizad A. Removal of Congo red from textile wastewater by ozonation. Int J Environ Sci Tech. 2008;5:495-500.
- Chatterjee S, Lee MW, Woo SH. Adsorption of congo red by chitosan hydrogel beads impregnated with carbon nanotubes. Bioresour Technol. 2010;101:1800-06.
- Chong MN, Jin B, Chow CW. Recent developments in photocatalytic water treatment technology: a review. Water Res. 2010;44:2997-3027.
- Han R, Ding D, Xu Y, et al. Use of rice husk for the adsorption of congo red from aqueous solution in column mode. Biores Tech. 2008;99:2938-46.
- Oladoja NA, Ololade IA, Idiaghe JA. Equilibrium isotherm analysis of the sorption of congo red by palm kernel coat. Cent Eur J Chem. 2009;4:760-68.
- Kannan N, Meenakshisundaram M. Adsorption of Congo Red on Various Activated Carbons. A Comparative Study Water Air Soil Pollut. 2002;138:289-305.
- Townsend TK, Browning ND, Osterloh FE. Nanoscale Strontium Titanate Photocatalysts for Overall Water Splitting. ACS Nano. 2012;6:7420-26.
- Blennowa P, Hagen A, Hansen KK. Defect and electrical transport properties of Nb-doped SrTiO3. Solid State Ionics. 2008;179:2047-58.
- Puangpetch T, Sreethawong T, Yoshikawa S, et al. Synthesis and photocatalytic activity in methyl orange degradation of mesoporous-assembled SrTiO3nanocrystals prepared by sol-gel method with the aid of structure-directing surfactant. J Mol Catal A Chem. 2008;287:70-79.
- Makarova M, Dejneka A, Franc J, et al. Soft chemistry preparation methods and properties of strontium titanate nanoparticles. Opt Mater 2010;32:803-806.
- Makarova M, Drahokoupil J, Bykov P, et al. Size Effect on the Structure and Optical Properties in Nanocrystalline SrTiO3. J Surf Sci Nanotechnol 2012;10:406-10
- Blennowa P, Hansena KK, Reine WL, et al. Strontium titanate-based composite anodes for solid oxide fuel cells. ECS Transactions 2008;13:181-94.
- Hu MZC, Miller GA, Payzant EA, et al. Rawn, Homogeneous (co)precipitation of inorganic salts for synthesis of monodispersed barium titanate particles. J Mater Sci. 2000;35: 2927-36.
- Liu X, Bai H. Liquid-solid reaction synthesis of SrTiO3 submicron-sized particles. Mater Chem Phys 2011;127:21-23
- Rabuffetti FA, Kim HS, Enterkin JA, et al. Synthesis-dependent first-order raman scattering in SrTiO3 nanocubes at room temperature. Chem Mater 2008;20:5628-635
- Hernandez BA, Chang KS, Fisher ER, et al. Sol-gel template synthesis and characterization of BaTiO3 and PbTiO3 nanotubes. Chem Mater 2002;14:480-82
- Yang J, Zhang J, Liang C, et al. Ultrathin BaTiO3 nanowires with high aspect ratio: A simple one-step hydrothermal synthesis and their strong microwave absorption. ACS Appl Mater Interfaces. 2013;5:7146-51
- Sasirekha N, Rajesh B, Chen YW. Hydrothermal Synthesis of Barium Titanate: Effect of Titania Precursor and Calcination Temperature on Phase Transition. Ind Eng Chem Res 2008;47:1868-75.
- Vaidyanathan B, Raizada P, Rao KJ. Microwave assisted fast solid state synthesis of niobates and titanates. J Mater Sci Lett 1997;16:2022
- Gibbsons KE, Jones MO, Blundell SJ, et al. Rapid synthesis of colossal magnetoresistance manganites by microwave dielectric heating. Chem Commun 2000;5:159-160
- Srilakshmi C, Saraf R, Prashanth V, et al. Shivakumara, Structure and Catalytic Activity of Cr-Doped BaTiO3 Nanocatalysts Synthesized by Conventional Oxalate and Microwave Assisted Hydrothermal Methods. lnorg Chem. 2016;55:4795-805
- Lagergren S. About the theory of so-called adsorption of soluble substances. K Sven Vetenskapsakad Handl. 1898;24:1-39.
- Ho YS, McKay G. Pseudo-second order model for sorption processes. Process Biochem. 1999;34:451-65
- Omar A, Mohammed Momani AS, Tasawar H. Application of reproducing kernel algorithm for solving second-order, two-point fuzzy boundary value problems. Soft Computing. 2017;21:7191-206
- Langmuir I. The adsorption of gases on plane surfaces of glass, mica and platinum. J Am Chem Soc 1918;40:1361-403
- Freundlich H. Über die adsorption in lösungen. Z Phys Chem. 1907;57:385-470.


