Net-Proton Number Fluctuations in the SST Nuclear Plasma
Received: 23-Mar-2023, Manuscript No. puljmap-23-6265; Editor assigned: 24-Mar-2023, Pre QC No. puljmap-23-6265(PQ); Accepted Date: Apr 19, 2023; Reviewed: 27-Mar-2023 QC No. puljmap-23-6265(Q); Revised: 31-Mar-2023, Manuscript No. puljmap-23-6265(R); Published: 15-Jun-2023, DOI: 10.37532.2023.6.2.1-4
Citation: Kornowski S. Net-proton number fluctuations in the SST nuclear plasma. J Mod Appl Phys. 2023,6(2):1-4.
This open-access article is distributed under the terms of the Creative Commons Attribution Non-Commercial License (CC BY-NC) (http://creativecommons.org/licenses/by-nc/4.0/), which permits reuse, distribution and reproduction of the article, provided that the original work is properly cited and the reuse is restricted to noncommercial purposes. For commercial reuse, contact reprints@pulsus.com
Abstract
Here we show that the kurtosis multiplied by the squared standard deviation for net-proton distributions in nuclear collisions validate the nuclear-plasma structure described in the Scale-Symmetric Theory (SST). We also described the SST nuclear phase diagram
Keywords
Antiprotons, Scale-symmetric theory, Nuclear-plasma
Introduction
One of the fundamental goals in physics is to understand the properties of the nuclear plasma and the hadronic phase of the matter when we change the collision energy of ions,  Thecomplexity of the system formed in heavy-ion collisions forced scientists to use advanced statistical methods. They use the moments to describe the characteristic of a distribution.
If a function is a probability distribution, then the first moment is the expectation value (the arithmetic mean of a large number of independently selected outcomes of a random variable), the second moment is the variance (a measure of how far a set of the same physical quantity is spread out from their average value), the third standardized moment (normalized by a power of the standard deviation σ) is the skewness (positive skew indicates that the long tail is on the right side of the distribution), the fourth standardized moment is the kurtosis (it describes how much of a probability distribution falls in the tails instead of its center), and so on.
The most important information about the nuclear structure of plasma is observed in the energy dependence of κσ2, where κ defines kurtosis, and σ is the standard deviation, of net proton distribution (i.e. number of protons minus a number of antiprotons) from the 0– 5% most central collisions because such dependence is non-monotonic.
But the Relativistic Heavy-Ion Collider (RHIC) data are incomplete and they sometimes differ from the theoretical predictions, so a new model is needed to explain discrepancies, and deficiencies in the description, and to predict results for missing energies of the central ion collisions.
Here we use the Scale-Symmetric Theory (SST) to describe the structure of the SST nuclear plasma, to describe the phase transitions in the SST plasma core and plasma corona, and to show how the function  should look, so we can verify our model [1].
The SST nomenclature and calculations
Reconstruction of proton, nuclear ionization and the SST nuclear-plasma core
In SST, nucleons (p and n) consist of the neutral core Ho= 724.776 MeV or positively charged core H+=727.439 MeV, and of a relativistic pion (neutral W(o),d=1=208.643 MeV or charged W(+-),d=1=215.761 MeV) in distance Rd=1 = A + B =1.199278 fm, where A = 0.6974425 fm is the equatorial radius of the baryonic core [1].
Reconstruction of the proton is a capture of the relativistic pion by the core of the baryon. Nuclear ionization is the emission of the relativistic pion by a proton or neutron. The charged core of baryons is the most stable, so the SST nuclear-plasma core consists of the baryonic cores, H+, packed to the maximum. To reconstruct a proton, first of all, we must reconstruct the Titius-Bode (TB) orbits for the nuclear strong interactions. According to SST, it is done by quanta with a mass MTB = 750.296 MeV that are quadrupoles, so it can be also MTB/4, MTB/2, 2MTB, 4MTB, and so on.
Torus/electric charge of proton and the SST nuclear-plasma corona
The torus/electric-charge of the proton is localized in the core of baryons and its mass is X±=318.2955 MeV. By an analogy to the electron:
e±bare,real + (e+e–)virtual, where e±bare,real is the real mass of the bare electron, we have X±real + (X+X–)virtual.
The X+X–pairs are the components of the SST nuclear plasma corona.
Net-proton number
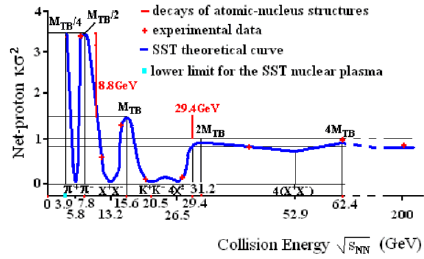
Net-proton number is the number of reconstructed protons minus the number of reconstructed antiprotons. For the nuclear-plasma corona, such number distance, ΔN, is zero. Just reconstruction of nucleons from the X+X– pairs lead to the same number of protons and antiprotons. Each baryonic core H+ can lead to one proton so we can normalize the function  for the nuclear-plasma coreat very high energies as ΔNhigh = 1. But at lower collision energies, due to the reconstruction of nucleons, there are created locally the alpha particles and the 1p1n pairs, so ΔNlower = 1.5. At the lowest collision energies, in the plasma core there can be created locally the cuboids 4p4n or 3p5n (it dominates in heavier nuclei), so ΔNlowest = 3.5.
The nuclear-strong constant
It is an analog of the gravitational constant, G, for the nuclear strong interactions: GS = 5.45651·1029 m3/ (kg s2).
The characteristic baryonic chemical potential μB,ch at T = 0
It is defined as the energy needed to emit the relativistic pion in the d = 1 state (the nuclear ionization)

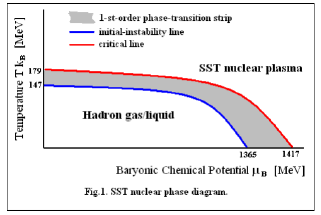
Such energies are needed to “ionize” the nucleons, so at T=0 for μB = 1417 MeV there appears the pure SST nuclear plasma (see Figure1).
The temperature of the SST nuclear matter and the temperature of phase transition
Temperature T we define as follows

where kB =1.380648·10–23 J/K=8.6173·10–11 MeV/K is the Boltzmann constant. The T we calculate from Wien’s displacement law –states that the black-body-radiation curve, for different temperatures, T, peaks at different wavelengths, λPeak, and λPeak is inversely proportional to T.

To create the SST nuclear-plasma core, we must pack the baryonic cores to the maximum, i.e. their distance must be λPeak=2A=1.395 fm.
From (6) and (4) we obtain

But the instability of the nuclear matter starts for λPeak=Rd=2 =(A + 2B)= 1.7011 fm (it is the ground state for the nuclear strong interactions above the Schwarzschild surface for the nuclear strong interactions), so we have

From SST follows that when distances between the components of the SST nuclear plasma are smaller (i.e. temperature T is higher) then the nuclear-ionization energy (i.e. the baryonic chemical potential μB) is lower, i.e. the energy needed to emit the relativistic pions by baryons is lower. There is no critical point in the SST nuclear phase diagram, there is the critical line. SST shows that the baryonic chemical potential (the energy of nuclear ionization) at T=0 of the relativistic charged pion in the last d=4 TB orbit is 1064 MeV.
Relationship between the collision energy  and thecharacteristic masses created in the SST nuclear matter
New fermions created in the matter must satisfy the following formula

where Mbare is the bare mass of the fermion mass M.
For the electron or the torus/electric-charge of a proton (X±) or a particle containing such objects, we have [1]

Then the ratio of relativistic mass and rest mass is

When energies of the exchanged particles have a mass equal to Mi = MTB/4, MTB/2, MTB, 2MTB, 4MTB, 8MTB, and so on, then the TB orbits of some H±cores are restored, so the number of protons increases. It causes the net-proton distribution increases as well, i.e. the plasma contains regions that are not nuclear plasma. From (11) we obtain that the masses Mi relate to

We can see that the SST nuclear plasma starts at energy 
For such collision energies, we should observe some maxima in the function  because they partially restore the structure of nucleons.
On the other hand, we should observe some minima for the following energies (then the SST nuclear-plasma corona dominates).

where d = 1, 2, 4, are the TB numbers [1].
From (11) we obtain that the masses Ed relates to

But from experimental data follows that in the nuclear plasma are additionally produced, first of all, the pions and kaons, so for the collision energies related to π+π– and K+K– pairs we also should observe deep minima

The baryonic chemical potential μB=1417 MeV relates to the collision energy  , so above such collision energythere is the pure SST nuclear plasma and there dominates the plasma core. It means that the net-proton κσ2 is close to 1 but lower than 1 because of the very thin corona composed of the X+X–pairs.
At low energies, the thickness of the plasma corona is relatively larger, so the annihilations of the X+X–pairs cause us to observe high particle yields in the low transverse momentum region.
Decays of the atomic-nucleus structures
According to SST, the bases of the cuboids interact due to the nuclear weak interactions, so the characteristic energy is Y= 424.12176 MeV – from formula (11) follows that such energy relates to the collision energy
 . At suchcollision energy, the cuboids decay to alpha particles but also to the proton-neutron pairs because some of the bases consist of 1 proton and 3 neutrons.
It means that the net-proton κσ2 decreases from 3.5 to 1.5. The upper limit for the nuclear-ionization energy at T=0 is μB,ch,upper=1417 MeV, so it relates to  . At suchcollision energy, the alpha particles and the 1p1n pairs decay to the single nucleons (more precisely, to the single cores of baryons) [2]. It means that the net-proton κσ2 decreases from 1.5 to 1.
Our results are consistent with the experimental data presented in Figure 2.
Kurtosis
Kurtosis is defined as

where δ N = N–M, M is the mean and σ is the standard deviation.
The central values of experimental data in Fig.2 (the red crosses) are from [2,3].
The SST chemical freeze-out
In SST, the nuclear strong interactions of nucleons in atomic nuclei at low energy follow from exchanges of the virtual non-relativistic pions πo=135 MeV and π±= 139.6 MeV.
Here we define the SST chemical freeze-out as the baryonic chemical potential, μB,freeze-out, at which the virtual non-relativistic pions or gluons decouple from nucleons an atomic nucleus consists of.
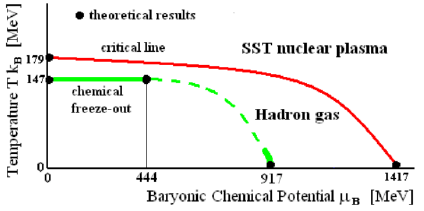
The virtual π+π– pairs, and gluons appear most frequently at the d=1 state where is placed the relativistic pion. Its radius of it is Rd=1= 1.199278 fm. From (1) follows that to emit the virtual non-relativistic charged pion from such a distance (it is the SST nuclear ionization) there is needed the baryonic chemical potential is equal to μB,freeze-out,low=917 MeV. Such freeze-out relates to  (seeformula 11). Such processes dominate at low temperatures.
When the collision energy increases, there appear gluons in the d = 1 state. With increasing baryonic chemical potential, energy of gluons increases from zero up to energy of the fundamental gluon loop (FGL, mFGL = 67.5444 MeV). From (1), follows that to emit the virtual FGLs from such a distance (it is the SST nuclear ionization) there is needed the baryonic chemical potential μB,freeze-out,high =444 MeV. The baryonic chemical potential increases from zero up to 444 MeV. The upper limit of the potential of such freeze-out relates to  Temperature for an interval of the baryonicchemical potential,
i.e. 0 MeV< μB,freeze-out <444 MeV, is practically invariant because, athigh temperatures, the distances between the nucleons are close toRd=2. We already calculated that the distance Rd=2 relates to T=147MeV.
For other temperatures, there is a combination of the two describedphenomena. At higher temperatures dominate the gluons while atlower temperatures dominate the virtual nonrelativistic charged pions(Figure 3) [4,5].
To explain the discrepancy between QCD and the experiment concerning the low transverse momentum region (we observe too many particles), the paper is formulated an alternative core-corona model for nuclear plasma [4]. But we claim that the SST core-corona model much better explains all unsolved problems. The Discovery of very massive early galaxies defies prior understanding of the evolution of the Universe [5]. The discrepancy was predicted within the SST already many years ago. We mentioned it because we cannot separate the evolution of nuclear plasma from the evolution of the early Universe. Both descriptions are closely related.
The transition from the SST nuclear plasma to hadronic matter at μB =0, i.e. 147 MeV
The green segment near μB,freeze-out,low = 917 MeV in Figure 3 represents the liquid-gas transition, it is close to 924 MeV presented in [10]. The SST boundary for the critical line at T=0 MeV, i.e. μB,ch,upper = 1417 MeV, is close to the value  presented in [2].
Conclusion
Orthodox methods used in physics are based on the search for a differential equation, which usually leads to a multi-parameter solution, and then the search for physical phenomena in order to interpret the appearing parameters. In the case of difficult problems such as the one described in this paper, such methods do not work at all because it is like a magician pulling a rabbit out of an empty hat. Often, new experimental data (and even known results) do not match the obtained solution of the equation, which means that practically the entire model is useless.
In the Scale-Symmetric Theory, we use a much more efficient method. Based on known physical phenomena or highly probable phenomena (like, for example, phenomena described by formulae (1) and (11) in this paper), we search for statistical distributions leading to maxima, minima, plateaux, boundaries, resonances, quantized values, and so on, and then combine the obtained points. The advantage of this approach is the fact that the curve obtained in this way has a real physical interpretation right away, and any discrepancies with new experimental data do not make it necessary to reject the entire model, but to search for new phenomena. What’s more, unlike looking for solutions to complex differential equations taken out of the empty hat, the SST method applied to extremely non-monotonic changes is practically guaranteed to be 100% effective. It caused the SST is the superior theory.
Here we showed that the SST core-corona model of nuclear plasma leads to very simple interpretation of the net-proton κσ2 distribution as a function of collision energy. Moreover, obtained theoretical results are consistent with still not numerous experimental data. We calculated the net-proton distribution for collision energies from 3.9 GeV (the SST nuclear plasma starts from such collision energy) up to 200 GeV, so we can verify our model.
The SST plasma core consists of the cores of baryons packed to the maximum, so the net proton distribution is higher than zero. The SST plasma corona consists of the torus-antitorous pairs (X+X–), so the net-proton distribution is zero.
In the cores of baryons and the tori/electric charges are also created, first of all, pions, kaons, gluons, and gluon loops, so the mass density of the SST nuclear plasma is higher than the mean energy density of the cores of baryons (>0.79 GeV/fm3) or mean energy density of thetori (>0.34 GeV/fm3)–it is consistent with experimental data (∼0.4 –1 GeV/fm3).
The gluons and exchanged particles quantize the distances between the components of the SST nuclear plasma, so the distances, via Wien’s displacement law, define the temperature of the SST plasma.
We showed that at collision energy 29.4 GeV of the plasma core, the nucleons in atomic nuclei decay to the single baryonic cores (they are not entangled but packed to maximum)–it suggests that it is the starting collision energy for the pure SST nuclear plasma.
References
- Kornowski S. Particles, Cosmology and Applications: ScaleSymmetric Theory (SST). 2022.
- Luo X, Shi S, Xu N et al. A study of the properties of the QCD phase diagram in high-energy nuclear collisions. Particles. 2020; 3(2): 278-307.
- Luo X. Energy dependence of moments of net-proton and net-charge multiplicity distributions at STAR. ArXiv 2015.
- Kanakubo Y, Tachibana Y, Hirano T. Non-equilibrium components in very low transverse momentum region in high-energy nuclear collisions. ArXiv 2022.
- Labbe I, van Dokkum P, Nelson E, et al. A population of red candidate massive galaxies~ 600 Myr after the Big Bang. Nature. 2023; 22:1-2.
- Borsanyi S, Fodor Z, Guenther JN, et al. QCD crossover at finite chemical potential from lattice simulations. Physical review letters. 2020; 125(5):052001.
- Adamczyk L, Adkins JK, Agakishiev G, et al. Bulk properties of the medium produced in relativistic heavy-ion collisions from the beam energy scan program. Physical Review C. 2017; 96(4):044904.
- Andronic A, Braun-Munzinger P, Redlich K, et al. Decoding the phase structure of QCD via particle production at high energy. Nature. 2018; 561(7723):321-30.
- Bazavov A, Bhattacharya T, Cheng M, et al. Chiral and deconfinement aspects of the QCD transition. Physical Review D. 2012; 85(5):054503.
- Fukushima K, Hatsuda T. The phase diagram of dense QCD. Reports on Progress in Physics. 2010; 74(1):014001.


