Right ventricular hemodynamics during controlled mechanical volume ventilation as compared to non-invasive ventilation
Received: 03-Oct-2018 Accepted Date: Oct 18, 2018; Published: 26-Oct-2018
Citation: Konecny F DVM. Right ventricular hemodynamics during controlled mechanical volume ventilation as compared to non-invasive ventilation. J Heart Res. 2018;1(1):6-13
This open-access article is distributed under the terms of the Creative Commons Attribution Non-Commercial License (CC BY-NC) (http://creativecommons.org/licenses/by-nc/4.0/), which permits reuse, distribution and reproduction of the article, provided that the original work is properly cited and the reuse is restricted to noncommercial purposes. For commercial reuse, contact reprints@pulsus.com
Abstract
Introduction: The influence of controlled mechanical volume ventilation (CMVV) on cardiovascular system in critically ill patients depends on predominant cardio-respiratory status. Overall, CMVV lessens RV preload while improving the LV afterload, hence in the presence of acute or chronic pulmonary disease; CMVV has to be carefully adjusted. CMVV adjustments should be made in real-time. In this study, recording of the right ventricular (RV) pressure-volume (PV) was made to characterize hemodynamic differences of CMVV with occurrence of spontaneous breathing (SB) compared to noninvasive ventilation (NIV), using mouse model.
Methods and Aims: During NIV, face mask was used while RV PV was measured using 1.2 F PV catheter accessing RV through right jugular vein navigated by transthoracic echocardiography. Next, transpharyngeal intubation and invasive CMVV using diaphragm opening and RV apical stab was used. Volume-ventilation setting (Vt and RR) was based on body weight. Isoflurane mono-anesthesia was used without any premedication.
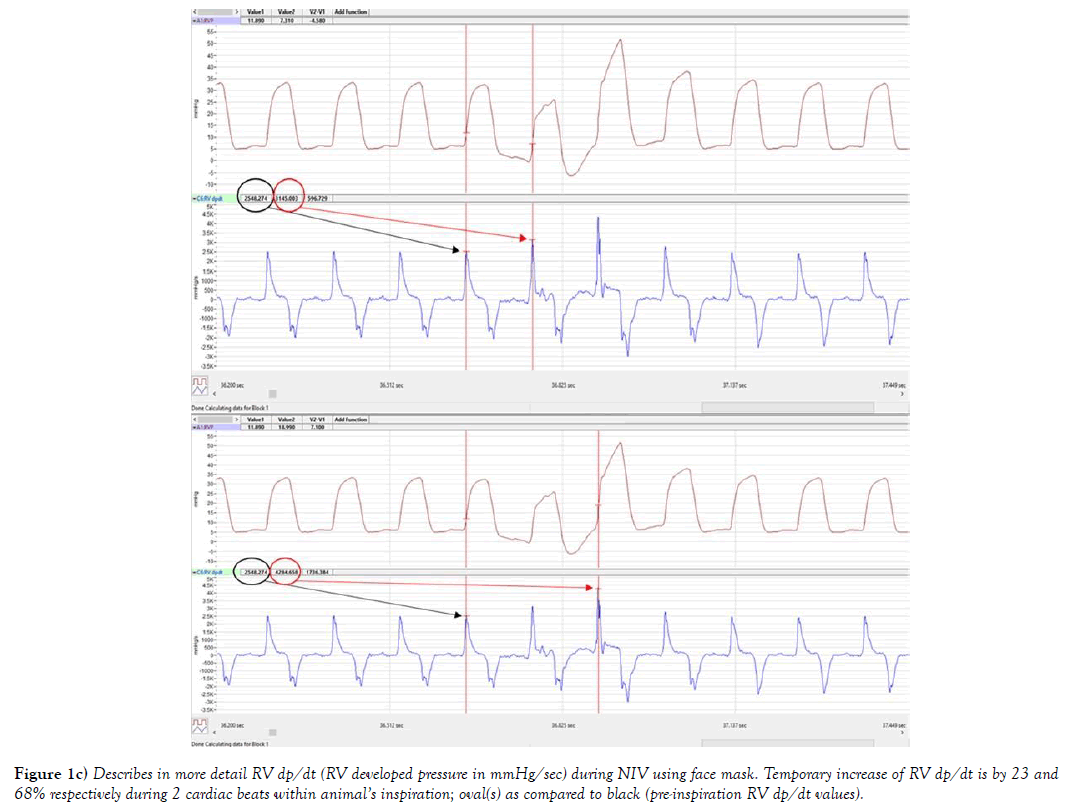
Results: Both ventilation conditions had specific effects on RV pressurevolume. In case of blood pressure gradient caused by effects of respiratory pump during CMVV in open chest setting with periodic SB, variations of RV stroke volume (SVV) and (or) RV CO were less significant as compared to NIV. Additionally, marked increase of RV dp/dt was observed during NIV. Furthermore, increase of RV dp/dt in 2 following cycles by 23% (596 mmHg/sec) and 68% (1736 mmHg/sec) were noticed. Interestingly, both RV EDP and RV EDV were found to be temporarily increased during NIV. Later, 100 cardiac cycles were compared to CMVV for RV CO and RV SV. In case of CMVV with recurrent periods of SB (RV SV was 26.1 ± 0.4 μl, and RV CO=13.2 ± 0.2 ml/min) as compared to NIV (32.5 ± 0.6 and 16.3 ± 0.3 ml/ min); p<0.001 for both.
Conclusions: The study revealed distinctive role of the respiratory pump action during close chest setting on RV preload. CMVV with periodic SB showed lesser variations of RV stroke volume (SVV) and RV CO supporting use of this ventilatory mode in patients with respiratory failure associated with afterload-dependent LV dysfunction. Hemodynamic influence of ITP/ TPP and other pressures generated by the action of CMVV needs to be studied using multiple pressure/PV sensors.
Keywords
Cardiopulmonary interactions; Hemodynamics; Ventilation; Right ventricle; Preload pressureAbbreviations
ALI: acute lung injury; ARDS: acute respiratory distress syndrome; CMVV: Controlled Mechanical Volume Ventilation; CO: Cardiac Output; EDP: End Diastolic Pressure; EDV: End Diastolic Volume; ITP/IPP: Intrathoracic/Intrapleural Pressure; LV: Left Ventricle; Mv: Minute Ventilation; NIV: Non-Invasive Ventilation; PEEP: Positive End Expiratory Pressure; PPV: Pulse Pressure Variation; PV: Pressure-Volume; PVR: Pulmonary Vascular Resistance; RA; Right Atrium; RAP: Right Atrial Pressure; RR: Respiration Rate; RV: Right Ventricle; RVP: Right Ventricular Pressure; RVV: Right Ventricular Volume; RV EDV: Right Ventricle End Diastolic Volume (preload volume); RV EDP: Right Ventricle End Diastolic Pressure (preload pressure); SB: Spontaneous Breathing; SV: Stroke Volume; SVV: Stroke Volume Variation; TPP: Trans Pulmonary Pressure; TBW: Total Body Weight; VILI: Ventilator Induced Lung Injury; Vt: Tidal Volume
Introduction
The systemic venous blood return depends on driving pressure created as a pressure gradient between right atrium RA/(RV) and large extrathoracic veins, for simplicity called (the right pressure gradient) as described by Guyton [1]. During non-invasive ventilation (NIV), pressure in the right atrium (RAP) is close to 0 mm Hg. At this RA pressure, venous blood return will be normal if other pressures e.g. systemic pressure and vascular resistance are not disturbed. By increasing RAP by 1 mm Hg, in animals whose sympathetic nervous systems had been blocked, Guyton et al in 1957 observed decrease of systemic venous return by 14% [1]. This interesting observation depicts how small misbalance of the right pressure gradient causes an unanticipated preload reduction. Furthermore, RV preload ceases at RAP at about +7 mmHg by completely decreasing the venous RA inflow. Conversely, if the RAP is reduced below 0 mm Hg, altered venous return response pattern is observed. For the first 1 mm Hg reduction in RAP, venous return increases by about 10% [2]. Interestingly, after this first drop to (–1 mmHg) every mmHg in pressure reduction does not lead linearly to an increase of venous return. Moreover, additional RAP reductions below (–4 mm Hg) are not increasing venous return any further [2]. The reason for the RAP non-linearity, i.e. increase of negative pressure gradient without further increasing of venous preload might be explained as follows: as RAP plateaus below (–4 mm Hg) it is followed by progressive collapse of veins as their luminal pressure falls below the extramural pressure (some veins just outside their point of entry into the chest might collapse during the inspiration, disallowing blood flow into the RA, as their intraluminal pressure falls below the atmospheric pressure) [2]. For example, inside the closed rat’s chest, during NIV using face mask when SB occur, the ITP/IPP averages approximately –3.7 to –4 mmHg (author’s unpublished observations), however it cycles between more sub-atmospheric values during inspiration while coming back, closer to atmospheric pressures during an expiration. Increase in both lung volume and ITP, as ITP coming back to less sub-atmospheric values (close to zero mmHg) reduces the LV end diastolic volume (EDV)/LV preload. As both ventricles are in series, the output of the right (RV) provides the input (venous return) for the left ventricle (LV) with the pulmonary circulation being midway. During lung pathologies such as in case of acute respiratory failure, after a widespread alveolar collapse, occurring e.g. post-operatively, use of CMVV for respiratory support is necessary. During CMVV, alveolar pressure of healthy lung parenchyma increases through its hyperinflation and use of PEEP. The effects of hyperinflation and PEEP exacerbate effects on hemodynamics by increasing RV afterload and thus limiting LV preload. Another clinical example of the effect of CMVV on RV hemodynamics can be found during acute lung injury (ALI) and acute respiratory distress syndrome (ARDS). During ALI and ARDS occurrence of alveolar collapse, airflow limitation and pulmonary hypertension occur. As a secondary effect, inflammatory mediators are released into circulation creating pulmonary vasoconstriction, myocardial depression, and systemic hypotension [3]. The combination of systemic hypotension and pulmonary hypertension has an adverse effect on RV myocardial oxygen supply (MVO2) and RV ischemia. To clinically avoid RV ischemia, RV preload (using volume loading), is subjected to great debate in current literature [4]. The use of RV PV catheter to monitor loading prevents the RV volume ‘overload”. Moreover, multiple ventilation techniques can be used clinically, ranging from non-invasive e.g. face-mask, through to an assisted mode (e.g. intermittent ventilatory modes) to completely controlled ventilatory modes with variety of use of PEEP to prevent airway collapse and to support alveolar recruitment. Any alveolar pressure overdistention and increase of ITP inevitably lead to increase of RV afterload. This study set out to describe role of the respiratory pump on RV hemodynamics during close and open chest setting to better understand role of NIV vs. CMVV influencing RV preload, and also how to minimize adverse cardiovascular effects using CMVV.
Material and Methods
Male 10-12 weeks old C57BL/6J wild-type (WT) mouse were obtained from Jackson Laboratory (Bar Harbor, ME). Colony was maintained under controlled conditions (22°C, 55%-65% humidity and 12:12-h light: dark cycle), with access to food and water ad libitum. Experiments adhered to the guidelines set forth in the Guide for the Care and Use of Laboratory Animals, published by the National Institutes of Health (NIH Publication No. 85-23, Revised 1996) and were performed under protocols approved by local Institutional Animal Care and Use Committee. Mouse weight, age, sex, and strain were marked into excel sheet before surgery. Animals were preanaesthetized with 3%-4% Isoflurane (Forane, Baxter, IL) using Vaporizer (SurgiVet., Smiths Medical PM, Inc., MA) and pediatric oxygen flow meter 0-3 LPM (WT Farley Inc., Camarillo, CA) to deliver 1.2 l/min directly into the induction chamber with lid. Later, mixture was adjusted to 1%-2% while Oxygen flow to 0.7 l/min. Mice was undisturbed during induction. An ophthalmic ointment was applied to prevent corneal drying. Animal fur was removed using depilatory cream Nair (Church & Dwight Co., Inc., Ewing, NJ). Animals were given 0.1 ml of pre-warmed 0.9% saline along with analgesics Buprenorphine (0.01-0.05 mg/kg) all i.p.
For controlled mechanical volume ventilation (CMVV), mice were translaryngeally intubated using a 21-gauge polyethylene catheter (Insyte-W catheter, BD, Mississauga, ON) with the help of fiberscope Fiber-lite (M- 150) (Dolan-Jenner Industries, MA) by directly illuminating the ventral area of the neck. To mechanically volume ventilate the animals MiniVent type 845 ventilator (Harvard Apparatus, St. Laurent, QC) was used to deliver tidal volume and respiration rate based on published formula [5]. The positive end-expiratory pressure of 2 cm of H2O was generated using the tubing’s collection port. To calculate wall oxygen flow rates used for nose cone or mechanical volume ventilator, the mouse of e.g. 25 g of tbw that is approx. (10-12 weeks old C57BL/6J); tidal volume (Vt) was multiplied by ventilation rate (200-300 bpm in an awake mouse, in calculations used 250). Here e.g. Vt of 25 g mouse is approximately 0.15 ml (0.6% of mouse body weight). The minute ventilation (Mv) for this mouse was (0.15 x 250); approximately 38 ml. When calculating oxygen flow rate of for this animal ventilation circuit death spaces was calculated. Two major death spaces were included i.e. an anatomical and mechanical death space. Space between the nose and the lung alveoli known as anatomical dead space was negligible in these mice, however circuitry and adapters between the anesthetic machine and mouse nose created significant mechanical dead space. As both dead spaces were excluded from mouse gas exchange they needed to be added to the calculations of Mv and oxygen flow rate respectively. In this case Mv of 38 ml of 25 g mouse would need flow rate supplement at least 0.5 liters/min of oxygen to accommodate for mechanical death space. The 0.7 l/min oxygen flow rate was selected and used. From this example, it was clear that mechanical death space had to be decreased to limit amount of Isoflurane gas that need to fill this space before reaching the mouse. The flow rate was adjusted when mouse breaths per minute has decreased during anesthesia from 250 to approximately one-tenth (~25 bpm). In this case when calculating oxygen flow rates, about 3.75 ml (0.15 x 25) and thereafter flow rate was lowered.
At this point in time PV micro-manometer catheter (1.2 F; 3.5 mm ring spacing, Transonic Scisense Inc., London, ON) was inserted into syringe with warm 35˚C-37˚C isotonic saline to allow pressure sensor to pre-soak for about 20 min before its use. Later, pressure sensor was balanced under meniscus of 37˚C isotonic saline. Electronic raw voltages channel calibration was performed using basic four channels IX-404 (Iworx, Dower, NH) A/D hardware with compatible PV module software to record, store and later analyze PV recordings. Temperature was constantly monitored using rectal thermometer.
Catheter was inserted into RV using 2 techniques. First technique was trough close chest and insertion using dissection and cannulation of right jugular vein, second technique was through open chest RV apical insertion. Animals were secured in dorsal recumbence on the heating pad while vascular access to right jugular vein was secured using two 7-0 silk sutures. After vein was cannulated, tip of the catheter was loosely secured using surgical knot to allow initial manoeuvring of the catheter in the vein. At the same time, venous pressure was detected and while during further catheter’s positioning it partially served as a guiding tool to reach the RV. Later, animal body was manoeuvred towards the catheter under direct supervision of transthoracic echocardiography up to the point when catheter appeared along the long axis in the RV chamber.
To perform second technique, skin incision was made towards the xiphoidal process starting from the right lower thorax quadrant/upper abdomen area. Abdominal wall, skin and abdominal muscles were retracted using home-made retractors and dissected not to injure other organs in the area. Diaphragm was cut through to expose the heart’s apex, avoiding incisions around sternum to limit bleeding coming from internal mammary arteries. Cardiac apex was gently maneuvered using moistened Q-tips. Subsequently, the RV long axis was located and secured using gauze. RV stab was made along the long RV axis while at the same time the PV catheter was inserted. After insertion pressure and magnitude loops were recorded to establish good position in the RV. Later, when good catheter position was found, baseline scan was performed to display pressure-volume RV loops. RV pressure and PV recordings were analyzed using Lab Scribe 3 software (Iworx, Dower, NH).
Note to Methods
During both experimenters, using face mask and during CMVV, only mixture of oxygen with Isoflurane was delivered. Periods of spontaneous breathing (SB) occurred in both cases. During SB attempts the intra-abdominal pressure further increased with inspiratory diaphragmatic descent as observed in both cases. At the same time as rib cage has expanded the intrathoracic pressure (ITP)/intrapleural pressure (IPP) declined allowing lungs to expand. RV preload volume (RV EDV) temporary increased during spontaneous inspiration while the RV afterload decreased, as described elsewhere. Using piston-delivered CMVV in these experiments had advantage of delivering fixed Vt, however partial disadvantage of development of excessive mean pulmonary or inspiratory pressures that might have occurred when level of anesthesia changed. The only option how to limit development of higher inspiratory/peak and transpulmonary pressures (TPP) during CMVV, was to continuously readjust Vt and RR. Setting of both, Vt and RR was calculated using formulas at reference [5]. Later however, only simple clinical monitoring of breathing patterns during ventilation was practiced without ability to uncover all signs of possible volutrauma as both input CMVV parameters were based on TBW and overall clinical status before onset of anesthesia.
Results
Right ventricular pressures during non-invasive ventilation (NIV) without occurrence of spontaneous breathing (SB)
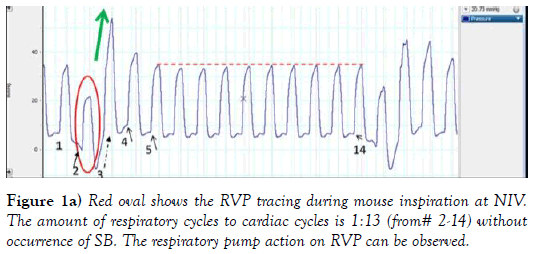
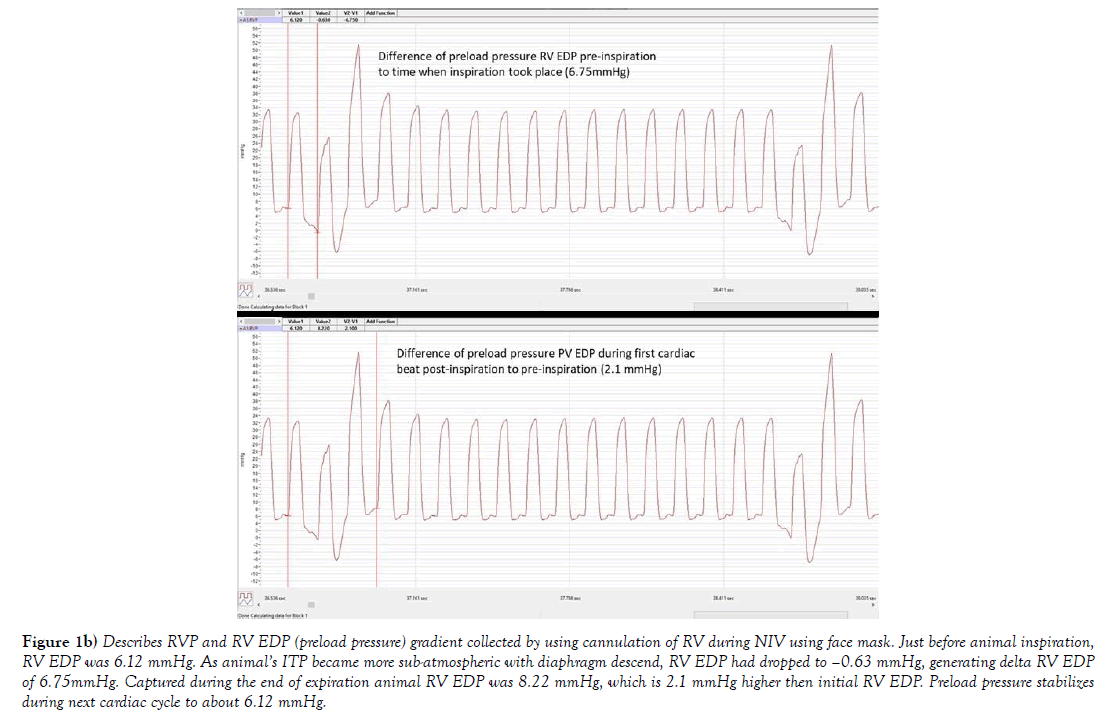
The systemic venous blood return depends on pressure gradient between right atrium RA/(RV) and large extra-thoracic veins. Figures 1a, 1b and 1c, provides description of the RV pressure gradient in mouse created by the respiratory pump during NIV without occurrence of SB. Influence of respiratory cycle on RV preload pressure can be observed during inspiration, as ITP, became more sub-atmospheric (close to -6 mmHg, author’s personal observation) the RVP trace (RV peak pressure, ESP and EDP) (red oval) followed this pressure trend. As RVP was temporarily following the ITP trend, RV EDP was decreasing below zero, seen also in more detail at Figure 1b. Both RV ESP and RV peak pressures also temporary declined (in the red oval at Figure 1. This has led to an immediate increase of RV developed pressure in the next 2 cardiac cycles by 23% (596 mmHg/sec) and 68% (1736 mmHg/sec); described at Figure 1c. Amount of venous blood inflow into RV was driven by the sub-atmospheric pressures in this example of NIV, tightly controlled by its timing (valve opening and closing). Green arrow shows the RV pressure upswing when ITP was rising back to its previous levels. Additionally, the first RV peak pressure was much higher (40 mmHg) due to prolonged RV filling, and next cardiac cycle was shortened (e.g. RV systole) seen as RVP peak incline. Interestingly, during the next cardiac cycle the RV EDP was also higher #4 at Figure 1, associated with closing of tricuspid valve at higher RV EDP, that is exactly 2.1 mmHg higher as it can be seen at Figure 1b, which almost immediately returned to value at #1 in the next cardiac cycle 5 (Figure 1). RV preload stabilized during next 10 cardiac cycles and at #14 (Figure 1), then SB cycle has been re-initiated.
Figure 1b) Describes RVP and RV EDP (preload pressure) gradient collected by using cannulation of RV during NIV using face mask. Just before animal inspiration, RV EDP was 6.12 mmHg. As animal’s ITP became more sub-atmospheric with diaphragm descend, RV EDP had dropped to –0.63 mmHg, generating delta RV EDP of 6.75mmHg. Captured during the end of expiration animal RV EDP was 8.22 mmHg, which is 2.1 mmHg higher then initial RV EDP. Preload pressure stabilizes during next cardiac cycle to about 6.12 mmHg.
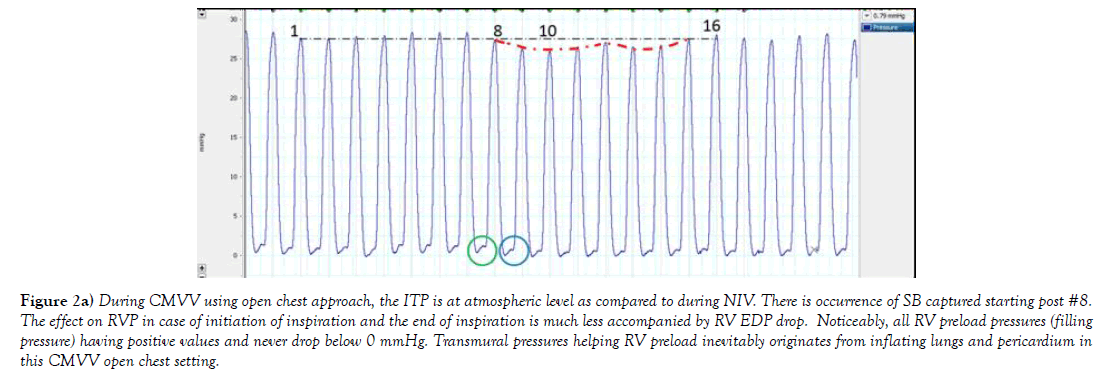
Figure 2a) During CMVV using open chest approach, the ITP is at atmospheric level as compared to during NIV. There is occurrence of SB captured starting post #8. The effect on RVP in case of initiation of inspiration and the end of inspiration is much less accompanied by RV EDP drop. Noticeably, all RV preload pressures (filling pressure) having positive values and never drop below 0 mmHg. Transmural pressures helping RV preload inevitably originates from inflating lungs and pericardium in this CMVV open chest setting.
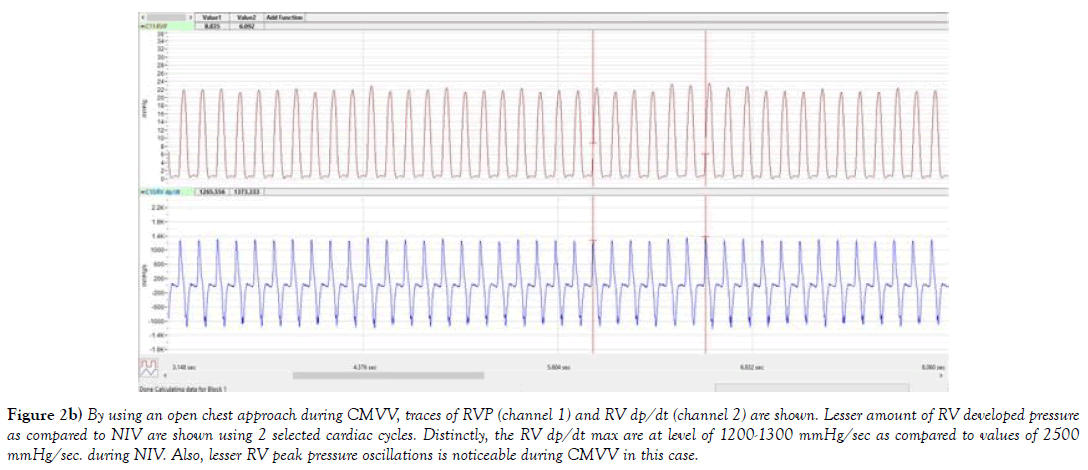
Figure 2b) By using an open chest approach during CMVV, traces of RVP (channel 1) and RV dp/dt (channel 2) are shown. Lesser amount of RV developed pressure as compared to NIV are shown using 2 selected cardiac cycles. Distinctly, the RV dp/dt max are at level of 1200-1300 mmHg/sec as compared to values of 2500 mmHg/sec. during NIV. Also, lesser RV peak pressure oscillations is noticeable during CMVV in this case.
Does RV preload temporary increases in cases SB during CMVV that leads to significant RV SV and (or) RV CO differences as compared to NIV?
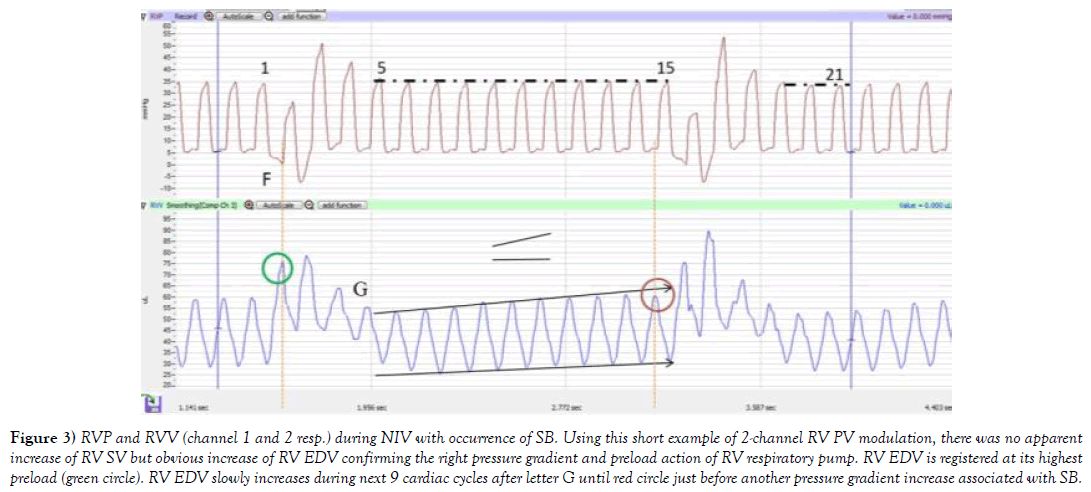
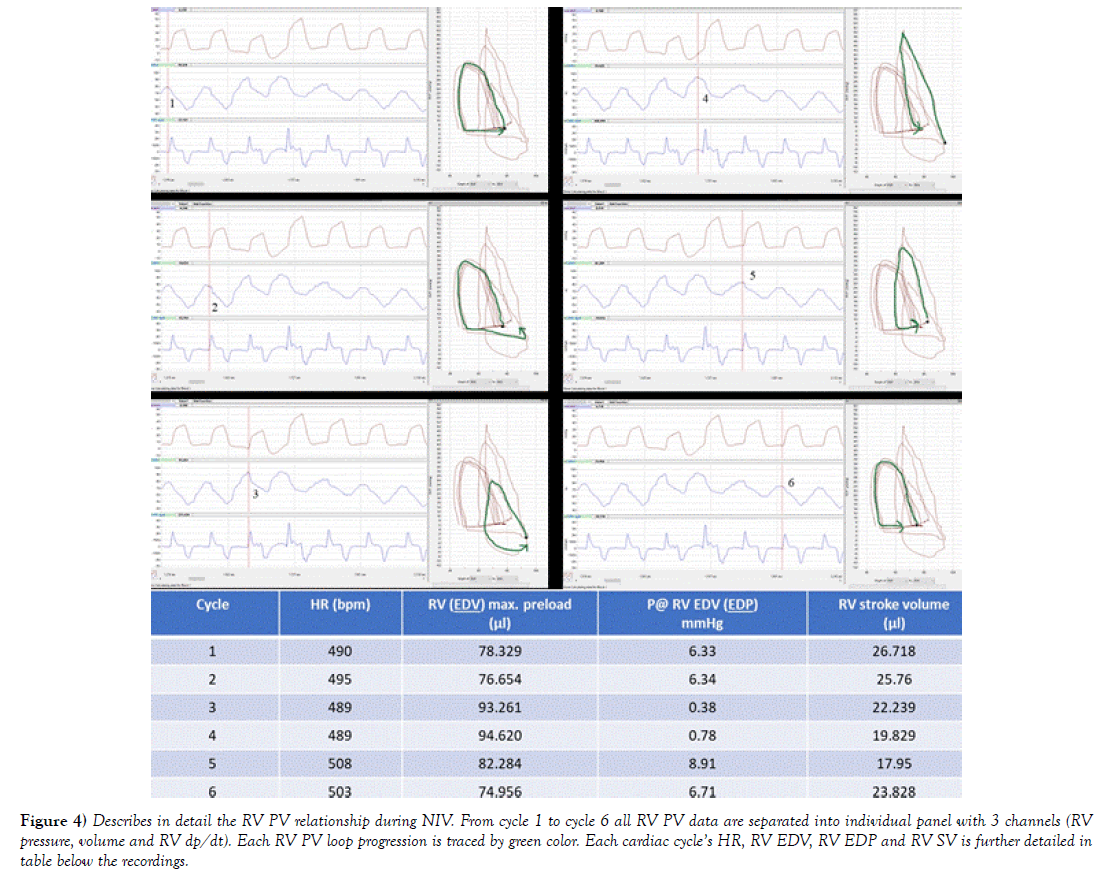
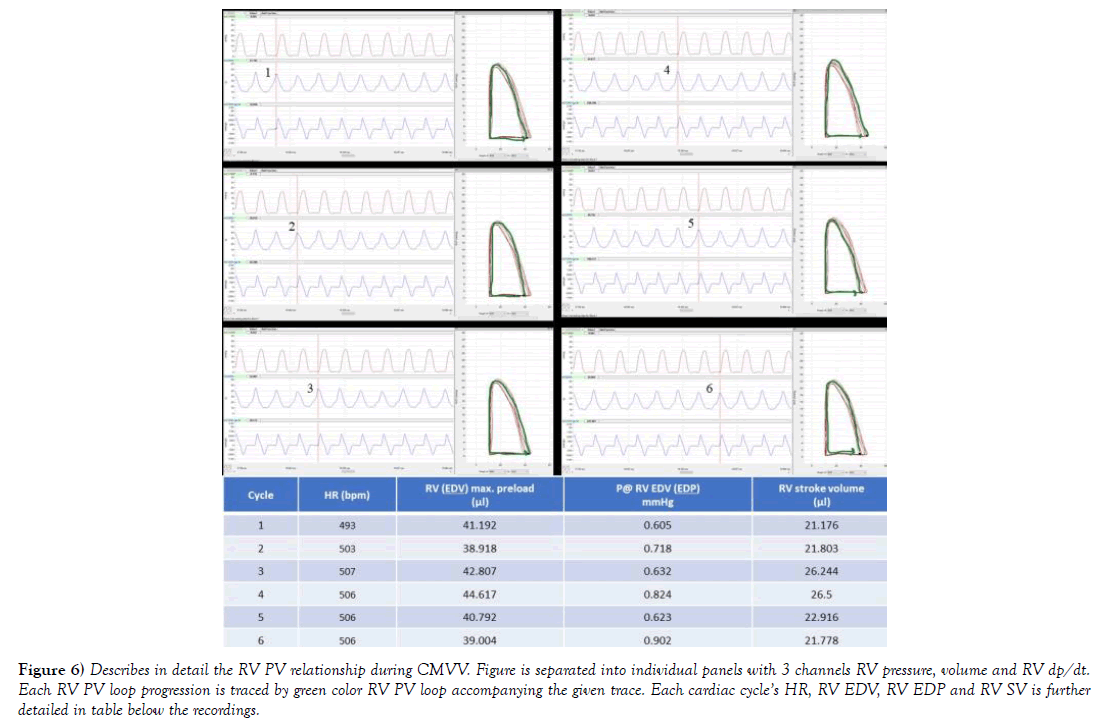
In case of NIV, venous preload depends on a pressure gradient between the extra thoracic veins and the RA as discussed in previous sections. Any increase of RV preload should inevitably lead to temporary increase of SVV and RV CO due to the “respiratory assistance” managed mostly by ITP/mean airway pressure and TPP gradient. TPP being difference of intra alveolar and ITP. To answer some of these questions, RV PV exams during closed chest were simulated. First at Figure 3, selection of the RVP and RVV traces during inspiration and expiration were captured. Interestingly, past inspiration during the end of expiration ESV and EDV were steadily climbing back to its previous level before the next inspiration (Figure 3 end of both arrows). Interestingly, this gradual volume shift was not observed during CMVV, as discussed later at Figures 5 and 6 below. By using software functions, total of 6 consecutive RV PV loops were composed to depict each cycle progression during NIV with occurrence of SB and to calculate RV SV, CO and other parameters. Data displayed in Figure 4 are organized based on Figure 3. First cardiac cycle in Figure 4 starts at two cardiac beats before the letter F. Additionally, associated with 6 consecutive cardiac beats, in Figure 4 all RV PV data are separated into individual panel with 3 channels, with table below showing how each RV preload pressure and volume has changed during following cardiac cycles given stable HR. RV SV is depicted in the last column. Taken together, data shows that NIV with occurrence of SB had significant influence on RV SV and RV CO.
Figure 3) RVP and RVV (channel 1 and 2 resp.) during NIV with occurrence of SB. Using this short example of 2-channel RV PV modulation, there was no apparent increase of RV SV but obvious increase of RV EDV confirming the right pressure gradient and preload action of RV respiratory pump. RV EDV is registered at its highest preload (green circle). RV EDV slowly increases during next 9 cardiac cycles after letter G until red circle just before another pressure gradient increase associated with SB.
Figure 4) Describes in detail the RV PV relationship during NIV. From cycle 1 to cycle 6 all RV PV data are separated into individual panel with 3 channels (RV pressure, volume and RV dp/dt). Each RV PV loop progression is traced by green color. Each cardiac cycle’s HR, RV EDV, RV EDP and RV SV is further detailed in table below the recordings.
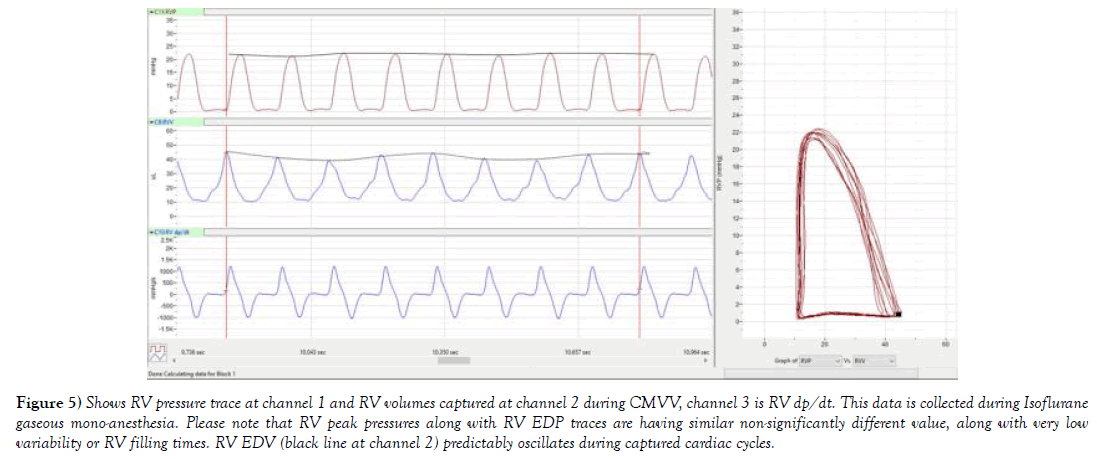
Figure 5) Shows RV pressure trace at channel 1 and RV volumes captured at channel 2 during CMVV, channel 3 is RV dp/dt. This data is collected during Isoflurane gaseous mono-anesthesia. Please note that RV peak pressures along with RV EDP traces are having similar non-significantly different value, along with very low variability or RV filling times. RV EDV (black line at channel 2) predictably oscillates during captured cardiac cycles.
Figure 6) Describes in detail the RV PV relationship during CMVV. Figure is separated into individual panels with 3 channels RV pressure, volume and RV dp/dt. Each RV PV loop progression is traced by green color RV PV loop accompanying the given trace. Each cardiac cycle’s HR, RV EDV, RV EDP and RV SV is further detailed in table below the recordings.
In the instance of PV traces being collected from open chest during CMVV at Figure 5, it is apparent that peak RVP does not fluctuate to the levels observed during NIV, and the pressure trace has predictable characteristic as compared to trace taken during NIV. The final effect on RVP is in part also reliant on amount of delivered inspiratory peak pressures, mean airway pressures and set PEEP, which is reliant on CMVV setting. During chest opening, atmospheric pressure ITP had negligible and more or less predictable effect on RV preload. RV EDV was stable and around 40-43 μl. In addition, during an open chest setting, PA afterload rarely increases due to CMVV if animal was healthy, and when parameters were set to current animal’s tbw (author’s personal observations). To further describe such situation 6 cardiac beats were selected during CMVV while using RV PV diagrams at comparable HR. To process larger sample size of pressure volume data, more than 100 cardiac beats, RV PV cycles were selected from NIV and compared to CMVV including periods of SB using RV CO and RV SV. In case of controlled mechanical volume ventilation (RV SV was 26.1 ± 0.4 μl, and RV CO= 13.2 ± 0.2 ml/min as compared to NIV (32.5 ± 0.6 and 16.3 ± 0.3 ml/min); p<0.001 for both.
Discussion
In case of ideally driven control mechanical volume ventilator in open chest setting, when compared to NIV, less pressure gradient in the system is created. Mechanical ventilation would in this case easing repetitive opening and closing of alveoli. Additionally, alveolar pressure would be at similar pressure level as piston would deliver similar amount of tidal volumes during each ventilatory cycle with possibilities to controlling the positiveend- expiratory pressure (PEEP) and peak delivered pressure and tidal volume amount. There will be however very little transmural pressure created on RV as compared to that during NIV. This partial resistance would still come from pericardium and other organs in the chest. Moreover, when lungs are ventilated using application of PEEP, repetitive alveolar over distensions can be reduced (also known as atelectrauma). In this case venous blood return, hence RV preload would still depend on some pressure gradient between the large and very compliant extra thoracic veins and the RA, though creating lesser amount of RV preload. This condition can be seen and compared using RV EDP and RV EDV at Figure 4 vs. 6. In addition, RV dp/dt max during CMVV would be reduced as compared to NIV in close chest setting, and maximal developed pressures would not be significantly different between cardiac cycles as seen Figure 3a, where (RV dp/dt max) maximal difference (1373 vs. 1265 mmHg/sec) is about 8% during multiple cardiac cycles.
Many control mechanical volume-based animal ventilators are not equipped to control for pressures delivered by the action of a piston. Hence during volume-based ventilation, small animal ventilators periodically deliver gas mixtures using single circuit and piston-type ventilator configuration. CMVV setting of respiration rate (RR) and tidal volume (Vt) is calculated based on tbw’s beforehand while information during ventilation such as e.g. peak inspiration pressure or other delivered pressures are often not measured or recorded. Further disadvantages of volume-based ventilation are that gas mixture has always higher peak inspiration pressure than that in the alveoli in order to reach the alveoli, and ventilator’s RR and especially delivered tidal volumes are not adjusted throughout experiments to limit volutrauma [6] and to support oxygenation and to reduce risk of alveoli overdistention (atelectrauma) [7]. Described in clinical literature as (bio trauma) [8] multiple organ dysfunction that is triggered by ventilator induced lung injury (VILI) responsible for systemic release of inflammatory mediators by both phenomena (i.e. volu and atelectrauma). In these set of experiments, pre-anesthesia was carried out using 4%-5% of halogenated gas in oxygen as mono-anesthesia without using any injectable anesthetics. Clinical observation of animal conditions was essential during all stages of anesthesia by testing and recognizing stages of anesthesia and by continuously monitoring animal reflexes. Limited amount of adjustments was made during CMVV and are discussed in study limitation section of this article.
Animal studies have shown that ventilation with large tidal volumes and zero end-expiratory pressure are more injurious than ventilation with small Vt and some PEEP, for a given peak pressure [9]. Lately, contradictory results from animal studies advocated to concurrently employing hemodynamic strategies to be regarded as an important read-out before ventilations are adjusted from high to low Vt or high to low PEEP [10]. This strategy would go hand in hand with e.g. direct or concurrent RV preload measurements to adjust delivered tidal or minute volumes. Additionally, ventilators that using volume mode, minute ventilation (Mv), peak inspiratory pressures and PEEP in cm of H2O might need to uniformly display such parameters in future to help with continuous animal monitoring during anesthesia. The next generation of ventilators should display such information continuously as pressure resistances might differ based on the anesthesia or change of procedural conditions. Here for example when the level of anesthesia changed from stage II to III (surgical plane anesthesia) in the close chest setting, the ITP has uncontrollably increased and acutely limited the RV preload. In cases of increase positive inspiratory pressures while not regulating sigh breath and PEEP post-chest opening, CMVV favors persistent higher alveolar pressures, temporary increasing lung volumes, while reducing the alveolar capacitance. The effect of this ventilatory condition on RV preload however also depends on the initial state of distention of alveolar vasculature and new created pressures during ventilation.
Compressive effect of increased lung volumes would be further coupled with effects on LV filling through parallel ventricular interdependence since LV would still share the same pericardial space and common interventricular septum. As pericardium is stiffer than LV or RV myocardium, it presents considerable resistance to volume increase to both ventricles [11]. Moreover, pericardium allows interaction of LV and RV that are independent of neural or humoral mechanisms [12]. And, if there is any increase of pericardial pressure the RV will be influenced to a greater degree during filling as compared to LV [12]. Hence opening pericardium would have effect on ventricular diastolic pressure-volume relationship in the RV as compared to LV with marked shift down and to the right i.e. RV would become more compliant [12,13]. In this study mouse pericardium has not been opened. Additionally, at Figure 2 when RVP is collected during CMVV during an open chest, RV EDP (preload pressure) has never dropped below zero, including during periods of attempted SB. Furthermore, the area of negative RV EDP at the inspiratory phase (as compared to during NIV) is absent from all tracings. Also, please note that the RV EDP during (points 8 to 10) that is associated with animal taking spontaneous breath, RV EDP did not drop below zero or into negative numbers. This have led to conclusion that even irregular SB taking during CMVV did not significantly augmented RV preload volumes which would have increased RV CO during 100 cardiac cycles. Multiple benefits have been associated with SB at NIV e.g. on neuromuscular function, hemodynamics and lung function [14]. Presented results using both models showing that it is important to systematically inquire about RV preload (pressures and volumes) during NIV and mechanical volume ventilation. There are multiple literature sources discussing overall (LV and RV) cardiac output changes when vein flow and (or) preload is limited, but little experimental data are available characterizing such interactions in the RV during mechanical ventilation with SB present (or) NIV with or without SB. In 1958 e.g. venous resistances were measured in experimental open chest dog model deprived of vasomotor reflexes, by predictable vein cuff obstructions. Results showed that obstructing incoming preload causes far more decrease in overall cardiac output as compared to increase of LV outflow using plastic microspheres [15]. Moreover, the overall CO but no RV cardiac output was characterized in this model without comparison of closed chest to open chest condition. In addition, veins are highly distensible and can store approximately 70% of total blood volume and can almost immediately capture moderately large blood volumes despite increased resistance to flow, while significantly decreasing both, RV and LV preload [16].
In this article, all Figure characterizing only the right cardiac hemodynamics during 2 ventilation conditions with SB condition that has occurred during animal ventilation. To further study of influence of both ventilation conditions to provide complete picture, pressures from chest cavity such as (ITP/IPP) needs to be much more closely monitored. ITP needs to be simultaneously recorded to analyze it along with RVP or RV PV data, for its later comprehensive analysis. In addition, measurements of mean airway pressures and TPP using very accurate pressure sensing devices needs to be also performed with data synchronously captured and then analyzed. First step, e.g. measuring ITP and how it influences the RV preload has not yet been successfully performed in closed chest cavity mouse animal model using NIV. Later, other airway pressures would allow to comprehensively characterize the effect of NIV. This research has not yet been performed as these accurate applications based miniaturized pressure sensors are still being developed. Esophageal pressure measurements in rodents to inquire about TPP were done in 1978 [17], using water-filled catheter. During closed chest and after chest opening researchers pointed out in discussion that surrogate measurement of TPP using esophageal pressure is valid measurement of TPP in ranges of rat vital lung capacities, however after chest opening mechanical properties of lungs has changed as temperature has dropped by 1°C-2°C. Additional research needs to be performed to answer questions of how much the esophageal pressure (in extension TPP) changes based on temperature change post-chest opening as some of newly developed miniaturized pressure sensors are temperature sensitive. In addition, to use small balloon catheter to measure pressures in the esophagus or other parts of rodent airways, using solid state sensor at the tip needs to be carefully explored. As we are moving into miniaturization and solid-state pressure sensors that are slowly becoming measurement commodity, only time will tell whether we can successfully collect pressures from intra and extra alveolar compartments along with RV PV to improve our chances to more understand pressure interactions during NIV and newly developed by using CMVV (with or without SB). This information would certainly expand our knowledge about ventilationinduced pathologies such as e.g. VILI, or other ventilator created pressurevascular resistances during different type of ventilations. By extension, gathered information from all pressure sensors would offer glimpse on how to better adjust animal volume ventilator setting to improve central and peripheral hemodynamics. Moreover, as measurements of both RV PV and LV PV are now performed synchronously, known as biventricular pressure-volume, using both along with TPP and ITP measurements would further information about influence of each type of ventilation (pressure or volume ventilation) on RV preload and LV afterload and e.g. cardiac elastance and (or) RV or LV coupling. Furthermore, as RV share the same pericardial space as the left ventricle (LV) with mutual interventricular septum, filling of the LV has been found decreased upon inspiration due to parallel ventricular interdependence [18]. More direct observations using synchronous biventricular pressure-volume loop during ventilation would confirm such phenomenon. During this study, both ventilation conditions had specific effects on RV. CMVV in open chest setting with periodic SB, showed variations of RV stroke volume (SVV) and (or) RV CO that were less significant, which support use of this ventilatory mode in patients with respiratory failure associated with afterload-dependent LV dysfunction. Clinically, it might be practical to first identify the cardio-respiratory interaction during NIV, and then consider using tailored CMVV approach in patients with pulmonary pathology.
Study Limitation
Volume-based ventilator should not impede RV preload and should be timely-adjusted to match the RV outflow in cases of e.g. changing neurohumoral conditions during changes of anesthesia’s depth (from stage II to III of gaseous mono-anesthesia) when e.g. alveolar over distension might occur due to persistently high generation of ITP/TPP. The constant afterload was carefully measured and adjusted as its increase might have negatively influenced the total resistance of the pulmonary circulation especially balance in the vascular tone of its two components: the alveolar vessels, and the extra-alveolar or parenchymal vessels. In some cases, lungs might have been inflated pass to its functional residual capacity (FRC) and alveolar vessels became compressed due to alveolar over-distension. This disallowed full accommodation of RV outflow, which over time temporarily increased RV afterload peak driving pressure and (RV ESP). This condition has occurred only sporadically, and results were not included into final data analysis. These situations were sudden not able to be captured by simple clinical observation hence belongs to limitations of this experimental set up. Third experimental condition, closed chest CMVV, was not included into this project as for difficulties of using endotracheal tube in mice while animal would be manipulated under transthoracic echocardiography in order to insert the RV pressure or PV catheter through jugular vein. Better technique and (or) set up needs to be designed to accommodate echocardiographic guidance of RV catheter when invasively ventilated.
Overall, measured RV hemodynamics shows that during NIV with comparable HR, the preload pressure and volume were both higher with significant increase of CO by rise of SV. RV filling phase was happening at higher pressures as compared to during mechanical ventilation. The RV ESP has also increased while dp/dt max reached significantly higher values during NIV that substantiated final higher RV stroke work (SW) in cases of NIV. In this study characterization of hemodynamic differences between CMVV compared to non-invasive ventilation were performed using small animal model. This was the first step of comparing acute PV-based hemodynamic parameters using healthy cardio-respiratory system. Animal size was limiting factor for collection of all acute physiological parameters of lung capacities during ventilation modes. Moreover, collection of blood to obtain multiple blood samples will be limiting factor in future study designs when monitoring requires measurement of e.g. blood gases, plasma cytokines, and other variables over time. Nevertheless, mouse models of human disease are widely used because of the development of genetically modified mice that can be used to assess the cardio-pulmonary patho-physiological function of specific genes. Hemodynamic function in relation to mode of ventilation can be later tested in these genetically modified mice.
REFERENCES
- Guyton AC, Lindsey AW, Abernathy B, et al. Venous return at various right atrial pressures and the normal venous return curve. Am J Physiol. 1957; 189(3):609-15.
- Young DB. San Rafael (CA): Morgan & Claypool Life Sciences; 2010.
- Price LC, McAuley DF, Marino PS, et al. Pathophysiology of pulmonary hypertension in acute lung injury. Am J Physiol Lung Cell Mol Physiol. 2012;302(9):L803-15.
- National Heart, Lung, and Blood Institute Acute Respiratory Distress Syndrome (ARDS) Clinical Trials Network, Wiedemann HP, Wheeler AP, et al. Comparison of two fluid management strategies in acute lung injury. N Engl J Med. 2006;354(24):2564-75.
- Tarnavski O, McMullen JR, Schinke M, et al. Mouse cardiac surgery: Comprehensive techniques for the generation of mouse models of human diseases and their application for genomic studies. Physiol Genomics. 2004;16(3):349-60.
- Gattinoni L, Carlesso E, Cadringher P, et al. Physical and biological triggers of ventilator-induced lung injury and its prevention. Eur Respir J Suppl. 2003;47:15-25.
- Slutsky AS, Ranieri VM. Ventilator-induced lung injury. N Engl J Med. 2013;369:2126-36.
- Uhlig S, Ranieri M, Slutsky AS. Biotrauma hypothesis of ventilator-induced lung injury. Am J Respir Crit Care Med. 2004;169(2):314-6.
- Dreyfuss D, Saumon G. Ventilator-induced lung injury: Lessons from experimental studies. Am J Respir Crit Care Med. 1998; 157:294–323.
- Dreyfuss D, Saumon G. Role of tidal volume, FRC, and end-inspiratory volume in the development of pulmonary edema following mechanical ventilation. Am Rev Respir Dis. 1993; 148(5):1194–203.
- Shintani H, Glantz SA. Chapter 6. The influence of the pericardium and ventricular interaction on diastolic function. In: Left ventricular diastolic function and heart failure. 1994b. Lea and Febiger, Philadelphia.
- Santamore WP, Gray LA Jr. Left ventricular contributions to right ventricular systolic function during LVAD support. Ann Thorac Surg. 1996;61(1):350-356.
- Calvin JE Jr. Pressure segment length analysis of right ventricular function: influence of loading conditions. Am J Physiol. 1991;260(4):1087-97.
- Yoshida T, Fujino Y, Amato MB, et al. Fifty Years of Research in ARDS. Spontaneous Breathing during Mechanical Ventilation. Risks, Mechanisms, and Management. Am J Respir Crit Care Med. 2017; 195(8):985-92.
- Guyton AC, Abernathy B, Langston JB, et al. Relative importance of venous and arterial resistances in controlling venous return and cardiac output. Am J Physiol. 1959 May;196(5):1008-14.
- Thiele RH, Nemergut EC, Lynch C 3rd. The physiologic implications of isolated alpha (1) adrenergic stimulation. Anesth Analg. 2011;113(2):284-96.
- Lai YL, Hildebrandt J. Respiratory mechanics in the anesthetized rat. J Appl Physiol Respir Environ Exerc Physiol. 1978;45(2):255-60.
- Cherpanath TGV, Lagrand WK, Schultz MJ, et al. Cardiopulmonary interactions during mechanical ventilation in critically ill patients. Neth Heart J. 2013; 21(4):166-72.


