Space threat to the USA - increase in mortality from ischemic heart disease due to high-energy alpha particles entering Earth's orbit
Received: 25-Jun-2023, Manuscript No. puljmap-23-6559; Editor assigned: 27-Jun-2023, Pre QC No. puljmap-23-6559(PQ); Accepted Date: Jul 06, 2023; Reviewed: 29-Jun-2023 QC No. puljmap-23-6559(Q); Revised: 01-Jul-2023, Manuscript No. puljmap-23-65599R); Published: 10-Jul-2023
Citation: Takuchev N. Space threat to the USA - increase in mortality from ischemic heart disease due to high-energy alpha particles entering Earth's orbit. J Mod Appl Phys. 2023; 6(3):1-13.
This open-access article is distributed under the terms of the Creative Commons Attribution Non-Commercial License (CC BY-NC) (http://creativecommons.org/licenses/by-nc/4.0/), which permits reuse, distribution and reproduction of the article, provided that the original work is properly cited and the reuse is restricted to noncommercial purposes. For commercial reuse, contact reprints@pulsus.com
Abstract
According to the World Health Organization, ischemic heart disease is at the top of the list of morbid causes of death on the planet. In a series of publications, data were presented on the existence of a dangerous phenomenon - a relationship between the annual mortality from ischemic heart disease and the annual average flow of cosmic positively charged particles with high energy reaching the Earth's orbit. The phenomenon is noticeable (due to the high correlation coefficients) in the health statistics of various countries located in the middle latitudes in the Northern Hemisphere. Mainly those are countries with a small territory, in particular Bulgaria, Malta, Austria, Hungary, Kyrgyzstan, and South Korea, but the phenomenon is also noticeable in countries like the Philippines and Cote d'Ivoire. The phenomenon is not noticeable in the data on the annual mortality of large countries of the same latitudes, such as the USA, China, and Russia. The US is the only country in the world with publicly available individual death statistics by location (state-level data were used), time (date of death was used), and cause of death (death from ischemic heart disease was used). The data on individual deaths from the USA make it possible to trace rapid processes in connection with the discussed phenomenon and to confirm with data the proposed hypothetical mechanism of this dangerous phenomenon. The mechanism presumes that the positively charged particles evoking death from ischemic heart disease are solar alpha particles with high energy. The mechanism was applied to analyze sudden unexplained spikes in the number of deaths from ischemic heart disease in the United States on March 4th and March 6th, 1978. Without being able to accurately predict the moments of occurrence of this dangerous phenomenon, the mentioned mechanism predicts depending on latitude the dates with the highest risk of death from ischemic heart disease induced by the alpha particles. According to the mechanism, the moments with the highest risk are local noon and local midnight.
Key Words
Ischemic heart disease; Solar alpha particles; USA; GOES satellites; Mortality
Introduction
I n a series of publications a danger to mankind phenomenon of cosmic origin was described – the fluxes of positively charged particles reaching Earth’s orbit are correlated with the mortality from the Ischemic (Coronary) Heart Disease (IHD) on the surface of the planet [1-9]. There is reason to believe that the particles affecting mortality are alpha particles. The phenomenon is difficult to be observed because it contributes to the increased mortality from IHD, to the mortality of which contribute many more obvious reasons - heredity, age, sex, lifestyle, and other diseases. According to statistics from the World Health Organization (WHO), IHD is at the top of the list of morbidity causes of death on the planet [10]. In the International Disease Classifier (ICD, 10th revision) IHDs are classified in classes I20 – I25. According to WHO data, 8.9 million people died worldwide from IHD in pre-pandemic 2019 [11].
According to Khan et al. the morbidity and mortality of IHD (the number of cases and the number of deaths from IHD per 100,000 people) are not spread evenly across the planet [12]. The highest mortality from IHD is in a region including Central and Eastern Europe. The mentioned dangerous phenomenon of cosmic origin has remained undetected, despite a sufficiently long series of years of space observations and medical statistics, because it is not observed in the statistical data of all countries. It is noticeable (i.e. has a statistically significant correlation between alpha particle fluxes and IHD deaths) for a few small area countries in Central and Eastern Europe and the Mediterranean – in the data for Bulgaria, Malta, Austria, and Hungary, but it is also observable for countries from Asia – Kyrgyzstan, South Korea, and the Philippines, even in Africa – Cote d'Ivoire. The countries where IHD mortality is most strongly correlated with high-energy alpha fluxes are located in a zone parallel to the Equator with approximate limits between 30°N and 50°N latitude. The described phenomenon is not observed in countries located near the North Pole. It is not observed in the statistical data of large countries such as the USA, Russia, and China, which are also located in the mentioned zone. This may be due to masking of the phenomenon in the general statistics for the large country if the cause acts on a limited area smaller than the country area and for a limited time – with duration much shorter than the periods of averaging the data for statistical purposes. This phenomenon would be expected to influence IHD mortality in countries south of the Equator too, but IHD mortality statistics for them are scarce, unreliable, or absent, preventing reliable inferences about such an influence in Southern Hemisphere.
The study, the results of which are presented below, is based on data from the United States, and aims to reveal whether the described phenomenon is specific only to small-area countries, such as those listed above, or whether it affects large countries as well, as it should is expected from a global phenomenon but is masked in area and time in the statistics.
Material and Methods
A prerequisite for this kind of study is the availability of reliable data – both on possible space impacts and mortality from IHD. More complex is the problem of the reliability of mortality data. Their obtainment requires a combination of good medical diagnostics covering the territory of the respective country, accurate administrative reporting, adequate national statistics, and easy access to statistical data for scientific purposes. The analysis below is based on US medical statistics from the National Center for Health Statistics (NCHS), for which the requirements listed above are fulfilled to the greatest extent [13]. The United States is the only country in the world to provide records of all individual deaths within the country.
They are a symbolic line of codes with a variety of information about the deceased. For the study, software was created to extract information about the location (state), month and day of death and the cause of death by ICD. This gives the possibility to track rapid changes (per day) in mortality from IHD and to draw conclusions about the possible dependence of mortality from IHD with shortterm processes in near-Earth space. Unfortunately, the day of death was included in individual records only in data for years before 1993, after which it was no longer monitored. This limits the study of rapid changes in mortality to only the years up to 1992.
Satellite data on corpuscular radiation – protons and alpha particles recorded by the satellites of series SMS (Synchronous Meteorological Satellites) and GOES (Geostationary Operational Environmental Satellites) were obtained from an NOAA site [14]. The satellites of the SMS and GOES series fly in geostationary orbit (above the Earth’s equator), at an altitude of 36,000 kilometers above the Earth’s surface and make one lap in 24 hours, that is, they “hang” over a certain point on the surface, do not shade from the Earth at their circumference around it. There is one satellite of the series over each of two meridians – over the east coast and the west coast of the United States. Data on alpha-particle and proton fluxes (unit: (number of particles).cm-2 .s-1 .sr-1 .MeV-1 ) were used with energies of the range 3.8–21.3 MeV. The fluxes were recorded by the satellite high-energy particle detectors:
1. Energetic Particles Sensor (EPS),
2. Energetic Proton, Electron, and Alpha Detector (EPEAD), and
3. HEPAD (High Energy Protons and Alpha particles Detector)
In particular, EPS and EPEAD detect alpha particles with energies from 3.8 MeV to 500 MeV, distributed in 6 channels. HEPAD detects alpha particles in two more channels with energy of 2.98 GeV and more than 3.4 GeV. The data are averaged over a 5- minute interval, during which there are up to 25 reports of the instrument. Part of the satellite data from the satellites GOES (operated in orbit in the interval 1999–2019) was processed statistically – it was averaged by year. Correlations were sought between their average annual values and both the annual number of deaths and mortality crude rate (number of deaths per 100000 inhabitants) from IHD for the USA. To track rapid changes in mortality, the number of deaths per day was calculated, both for the entire U.S. and for the individual states. The calculations were made for intervals of 7 days. The intervals were chosen to cover the days with satellite-recorded peak values of alpha particle fluxes. To the extent that the hypothetical mechanism proposed below explaining the observed phenomenon assumes that charged particles of high energy pass through the atmosphere and reach the Earth’s surface, the energy required for this was calculated from databases and calculators PSTAR and ASTAR [15,16]. Geomagnetic field data were obtained from the INTERMAGNET site [17]. Correlation analysis was used to process the data.
Results
Below, using US data as an example, the impact of cosmic radiation on IHD mortality is examined in relation to the area and time frames of the impact. Before that in the next section 3.1 a mechanism of the investigated processes, necessary for the analysis of the obtained results, is presented, and the missing information in which is supplemented with a hypothetical one.
1. Hypothetical mechanism of the described phenomenon
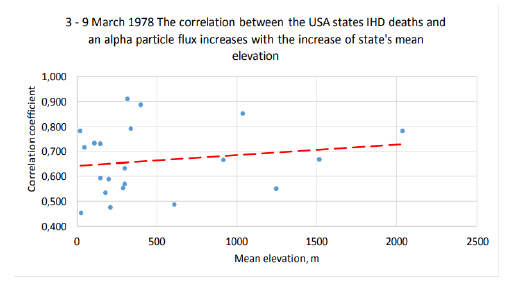
1.1 The study of the factors affecting mortality from ischemic heart disease in several countries showed that it increases with increasing altitude [4]. A concrete example of this is Figure 1, which shows as dots the correlation coefficient between alpha particle flux and the number of IHD deaths in individual US states for which this coefficient is greater than 0.45. In the figure, the correlation coefficient is shown as a function of the mean elevation of the state. It can be seen that the coefficients form an upward trend with altitude, i.e. the dependence of mortality on the flow of alpha particles increases with altitude, which provides information about the most likely mechanism of the studied phenomenon – the impact is carried out by particles invading from space.
1.2 Streams of high-energy particles affecting the physiology of humans on the surface of planet Earth and causing death from IHD are emitted by processes on the Sun. Evidence in favor of this claim is, in particular, the increased flux of positively charged particles recorded by satellites during Earth-directed Solar Mass Ejections (SMEs) at the same time as the number of deaths from IHD increases. This does not exclude other, significantly shorter-lived solar phenomena from emitting fast positively charged particles – such could be, for example, solar flares, coronal holes, or another phenomenon of the Sun. Indirect evidence for the Sun as a source of positively charged, high-energy particles is that this assumption convincingly explains the downstream processes that ultimately lead to death from IHD.
Streams of high-energy positively charged particles have nothing to do with the solar wind, whose particles are constantly emitted in all directions and move tens of times slower.
1.3 The lethal effects are due to alpha particles penetrating through the atmosphere and reaching the Earth's surface. Only particles whose energy is above 2.4 GeV for protons and over 6.2 GeV for alpha particles could penetrate the atmosphere to Earth's surface. These indicative kinetic energies were obtained using the PSTAR and ASTAR calculators, and applied with data for a homogeneous atmosphere – an atmospheric model with constant density, temperature, and pressure decreasing with height [4].
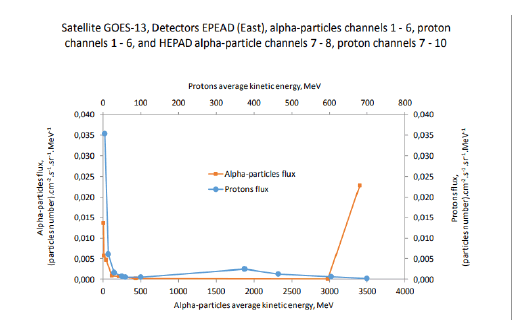
Figure 2 shows the average fluxes of alpha particles and protons measured by the EPEAD and HEPAD detectors on board the GOES13 satellite within December 2017, 3922 records.
It can be seen from the figure that as the energy of the particles increases, their flow decreases. For protons the flux decrease is monotonic and for energies above 0.7 GEV the proton flux is negligible, i.e. for energy on the order of 2.4 GeV, which would allow protons to reach the Earth's surface, their flux is practically zero. Another is the behavior of the alpha particle stream. After its initial decrease, for energies above 3.4 GeV the alpha particle flux increases again, reaching values exceeding those characteristic of small energies. A stream of alpha particles with energies above 3.4 GeV probably also contains those with energies of the order of 6.2 GeV, capable of penetrating the Earth's atmosphere and reaching the Earth's surface. Since the detection of alpha particles with energies of the order of 6.2 GeV goes beyond the design parameters of the detectors of the GOES satellites, the existence of streams of alpha particles with such high energy remains hypothetical.
From this analysis it follows that the hypothetical positively charged particles capable of causing death from IHD are alpha particles, in the following consideration proton fluxes are excluded as a potential risk for death from IHD.
It is assumed that solar alpha particles with very high energy – several GeV – reach the Earth's orbit. They remain not registered by the satellites because their energy exceeds the energy range for which their sensors are designed. Undetected high-energy alpha particles likely arise as a result of an explosive process on the Sun simultaneously or around the time of occurrence of the alpha particles detected by the satellite sensor. An alpha particle energy of the order of a few GeV means that it is moving at a speed close to the speed of light. For example, one can calculate that an alpha particle with a rest mass of 6.64465723.10-27 kg, with an energy of 7 GeV (1.12152411.10-9 J) moves at a speed of 281000 km/s and travels the distance from the Sun to the Earth (149.6.106 km) in 8.87 min. That is, the alpha particles capable of passing through the Earth’s atmosphere are so fast that they arrive at the observation point on the Earth's surface directly from the center of the Sun's disk, minutes after being emitted from the Sun's surface.
Entering the human body, these particles are capable of causing massive ionization, damaging biological tissue, and even nuclear reactions, causing the appearance of a beam of many other particles that also damage tissue through ionization. Probably the most sensitive to such damage is the circulatory system, in which, as a result of ionization, clots can form, carried by the bloodstream to vital organs. There, the clots can cause blockage of a vital blood vessel. Elderly people with already damaged and narrowed blood vessels are especially at risk.
1.4 During the year, the solar culmination (the angle of maximum elevation of the Sun above the horizon during local noon at the point of observation), which is different for different geographical latitudes, changes its magnitude in time as well. For the Northern Hemisphere from a minimum value on December 21 (early winter) reaches a maximum value on June 21 (early summer), then decreases back. When for the observation point from the Earth's surface the Sun is at its culmination, the invading particles from the Sun move through the thinnest part of the atmosphere, i.e. the probability of penetration to the Earth's surface is greatest. The alpha particles that the detectors on the satellites register do not have the necessary energy to pass through the atmosphere and reach the Earth's surface.
1.5 It can be calculated that alpha particles detected by the satellite with energy in the range of 5–10 MeV reach the Earth's orbit about two hours later than the hypothetical fast particles in the example above. Registered particles cannot penetrate the atmosphere, i.e. they are only an indicator, delayed by two hours, of the hypothetical very high-energy particles that reach the Earth's surface (if both the hypothetical and the indicator alpha particles are emitted simultaneously in a common blast process of the Sun). This means that the meridian with the solar culmination at the time of registration of the indicator radiation by the satellite is 30° west of the meridian at which the hypothetical alpha radiation reached the Earth's surface two hours earlier (the Earth rotates at an angular velocity of 15°/hour). That is, the damage to humans from the hypothetical alpha radiation would have occurred 2 hours before the detection of the indicator radiation by the satellite and the center of the deadly spot would have been 30° east of the meridian of registration.
1.6 Both indicator alpha particles and hypothetical fast alpha particles with energies of the order of GeV irradiate the entire sunlit part of the Earth's atmosphere. Indicator alpha particles do not reach the Earth's surface. Hypothetical fast alpha particles can penetrate to the Earth's surface only in a limited region where favorable penetration conditions are combined, the first of which was noted above – the layer of atmosphere for the particles to overcome is thinnest during the solar culmination. The most permeable for hypothetical fast particles is the atmosphere above the point on the Earth's surface, for which during the solar culmination there is a coincidence between two directions – of the geomagnetic induction vector at the point and of the invading alpha-particles. Alpha particles are then unaffected by the deflecting force of the geomagnetic field and are most likely to penetrate the atmosphere to the Earth's surface, creating a “deadly spot” around the "point of impact" on the Earth's surface where these two directions coincide. The geomagnetic induction vector (geomagnetic vector) has a constant direction relative to the Earth's surface at the point of observation. For the Northern Hemisphere, the geomagnetic vector points down to the point and northward and lies in the plane of its meridian (if the slight misalignment between the geographic North and South magnetic poles is ignored). The direction of the geomagnetic vector is characterized by the angle (the inclination I) between the geomagnetic vector and the horizontal surface at the observation point. The further north the observation point is located on the Earth's surface, the greater the inclination of the geomagnetic vector at the point. Along the apparent path of the Sun to the north and then to the south during the year, depending on the latitude of the point of observation, the culmination of the Sun aligns with the inclination of the geomagnetic vector twice, once, or never. Calculations show that for the Northern Hemisphere, the highest latitude for which a coincidence between the solar culmination and the inclination of the geomagnetic vector is possible is 48° (about June 21st, this explains the lack of correlation between IHD mortality and the flux of alpha particles for the Nordic countries, whose latitudes are above 48°), and the smallest –28° (about December 21st) [4]. The magnitude of the flux of alpha particles depends on the length of their path through the Earth's atmosphere to a given point on the Earth's surface – the longer the path through the Earth's atmosphere, the weaker the flow of hypothetical alpha particles penetrating the atmosphere to the surface. The most attenuated on its way through the Earth's atmosphere would be a stream of alpha particles around December 21st . It can be summarized that in the zone 28°N–48°N, there are points on the Earth's surface, where twice a year at noon, conditions are created for coincidence in the directions between the vector of the geomagnetic field and the invading solar alpha particles if any occur at this time. These conditions probably allow a part of the solar alpha particles with high energy to reach the Earth's surface and affect living organisms. Outside the said zone, these conditions disappear. These two geographical parallels 28° and 48° delineate the northern and southern borders of Central and Eastern Europe and the Mediterranean where, as stated above, the morbidity and mortality rate of IHD is highest. The increased risk of an IHD incident outdoors around local noon is a further argument for the healthfulness of the indoor midday break ('siesta') practiced in Mediterranean countries.
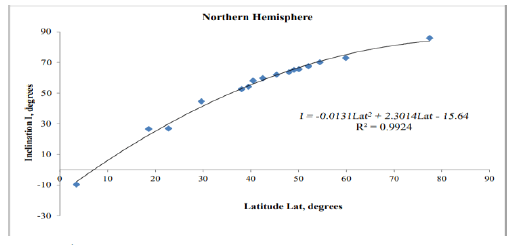
The dependence of I on the latitude Lat at the location of 16 geomagnetic stations in the Northern Hemisphere is shown in Figure 3 According to data from Intermagnet [17].
Figure 3: Dependence between inclination I of geomagnetic induction and latitude Lat according to data from 16 geomagnetic stations in the Northern Hemisphere (with International Association of Geomagnetism and Aeronomy Code: UPS, THL, TAM, SPT, PAG, NGK, MNK, LON, DOU, CLF, BDV, ABG, IZN, PEG, ELT, and TUN [17]). The inclination varies between -15.6° for 0° latitude and 85.4° for 90°N latitude. The figure also shows the analytical form of this dependence
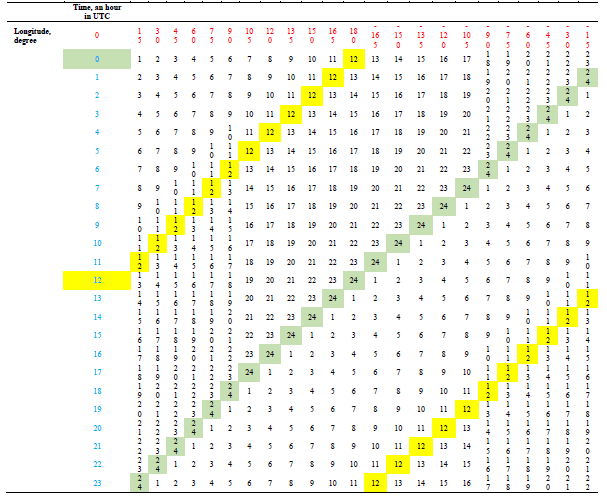
The hours for which latitude is determined are in the leftmost column, marked in blue. The local noon for the respective hour is indicated in a cell with a yellow background, the local midnight is in a cell with a gray background. In the first line in red, the corresponding longitudes are given. Coordinates east of the Greenwich meridian are positive, and those wests of it are negative
1.7 The point of impact and the deadly spot around it are unobservable. "Registration point" below is the point on the Earth's surface for which the culmination of the Sun coincides with the inclination of the geomagnetic vector at the time of registration of the alpha flux from the satellite detector. The detector registers the time continuously, so this moment is known. That is, the registration point can be determined, and tentatively it could serve to determine the location of the impact point and the death spot around it, since, as mentioned above, the impact point is about 30° east of the registration point (the moment of impact is about two hours before the moment of registration). To determine the longitude of the registration point, the Universal Time Coordinated (UTC) hours and minutes were converted to geographic coordinates using Figure 4 and Table 1.
The hours for which latitude is determined are in the leftmost column, marked in blue. The local noon for the respective hour is indicated in a cell with a yellow background, the local midnight is in a cell with a gray background. In the first line in red, the corresponding longitudes are given. Coordinates east of the Greenwich meridian are positive, and those wests of it are negative
Time in GOES satellite data has the format: Date Time, for example, 1978-02-26 21:50:00.000 UTC. At the instant of the example, 21:50 UTC, containing 21 round hours, from Table 1 the local noon longitude for the round hours can be determined, i.e. -135°, (the yellow cell with 12:00 UTC on row 21 corresponds to -135° read from the first row of data). The addendum to the longitude corresponding to the minutes, in the example 50 minutes, is taken from Table 2, i.e. the addendum is -13°. Finally, local noon corresponding to the moment in the example occurs at a meridian of longitude -148°W (west of the Greenwich Meridian). Similarly, at this time local midnight is at 32°E (east of the Greenwich Meridian).
TABLE 2.Addendum for determining by the minutes in UTC the longitude of the registration point with an accuracy of one degree
|
Time, minutes in UTC |
0 | 5 | 10 | 15 | 20 | 25 | 30 | 35 | 40 | 45 | 50 | 55 | 60 |
|---|---|---|---|---|---|---|---|---|---|---|---|---|---|
|
Addendum to Longitude, degree |
0 | -1 | -3 | -4 | -5 | -6 | -8 | -9 | -10 | -11 | -13 | -14 | -15 |
The latitude of the point of registration depends on the date of registration. To determine the relationship of latitude with the date of registration, the declination of the center of the Sun's disk, which depends on the date, was used. The declination of the center of the solar disk is the angle of its deviation from the plane of the celestial equator in the equatorial coordinate system. During the annual movement of the Sun, its declination gradually changes within ± 23.44° (± 23° 26′ 22″). The Solar disk declination is zero during the equinoxes – the vernal one on March 21 and the autumnal one on September 22. It increases from December 21st to June 21st and after that, decreases back to December 21st. The declination remains positive between the vernal and the autumnal equinox and negative between the autumnal and the vernal equinox. The values of the declination of the center of the solar disk are tabulated by dates and can be found for example from the site Astronomical Calendar – 2020 [18]. For each north latitude the corresponding declination was calculated, and through it, the dates of coincidence of the inclination with the culmination of the solar disk were obtained from the astronomical calendar [4]. The results are shown in Table 3.
TABLE 3.Dates of coincidence of the inclination of the geomagnetic vector with the culmination of the Sun for the Northern Hemisphere during noon and midnight
|
Latitude, Northern Hemisphere, degrees |
An Inclination of the geomagnetic vector, Northern hemisphere, degrees | Sun declination in celestial equatorial coordinate system Northern hemisphere, degrees | Date of the maximum risk, at noon, Northern hemisphere | Date of the maximum risk at midnight, Northern hemisphere |
|---|---|---|---|---|
|
49 |
65.7 |
|
||
|
48 |
64.6 | 22.6 | 6 June and 7 July | 7 December and 6 January |
|
47 |
63.6 | 20.6 | 24 May and 20 July | 25 November and 18 January |
|
46 |
62.5 | 18.5 | 14 May and 30 July | 15 November and 27 January |
|
45 |
61.4 | 16.4 | 6 May and 7 August | 8 November and 4 February |
|
44 |
60.3 | 14.3 | 29 April and 14 August | 1 November and 10 February |
|
43 |
59.1 | 12.1 | 22 April and 21 August | 25 October and 17 February |
|
42 |
57.9 | 9.9 | 16 April and 27 August | 19 October and 23 February |
|
41 |
56.7 | 7.7 | 9 April and 3 September | 13 October and 1 March |
|
40 |
55.5 | 5.5 | 4 April and 8 September | 7 October and 6 March |
|
39 |
54.2 | 3.2 | 29 March and 15 September | 1 October and 12 March |
|
38 |
52.9 | 0.9 | 21 March and 20 September | 25 September and 18 March |
|
37 |
51.6 | -1.4 | 17 March and 27 September | 19 September and 24 March |
|
36 |
50.2 | -3.8 | 11 March and 2 October | 13 September and 30 March |
|
35 |
48.9 | -6.1 | 5 March and 9 October | 7 September and 31 March |
|
34 |
47.5 | -8.5 | 26 February and 15 October | 31 August and 12 April |
|
33 |
46.0 | -11.0 | 20 February and 19 October | 24 August and 19 April |
|
32 |
44.6 | -13.4 | 13 February and 27 October | 17 August and 26 April |
|
31 |
43.1 | -15.9 | 5 February and 6 November | 9 August and 4 May |
|
30 |
41.6 | -18.4 | 27 January and 16 November | 30 July and 14 May |
|
29 |
40.1 | -20.9 | 15 January and 26 November | 18 July and 25 May |
|
28 |
38.5 | -23.5 | 1 January and 22 December | from 10 June to 2 July |
|
27 |
36.9 |
|
The latitude of the registration point is related to the corresponding date. The dates are for 2020, but in practice, they are valid for many years, as over the years the dates may change from those shown in the table by only one day due to the adjustment of the calendar with a leap year every 4 years
or the registration point of the example above, a longitude of - 148°W was determined (from Tables 1 and 2). The example date 26 February from Table 3 corresponds to latitude 34°N. Finally, the registration point in the example has geographic coordinates 34°N, - 148°W, i.e. if at the moment of the example the satellite registers a stream of alpha particles, at that point the solar culmination coincides with the local inclination of 47.5°, calculated by the formula in Figure 3. The point of registration serves as a guide to where the point of the potential impact of the hypothetical alpha particles on the Earth's surface is two hours earlier.
The point of impact is approximately 30° east of the point of registration, i.e. the point of impact has coordinates: 34°N, -118°W (the geographical position of Los Angeles area USA). The point of impact is the center of the deadly spot, where solar alpha particles with energies of several GeV would have hit, two hours before the indicator alpha particles of lower energy were recorded by the satellite. The indicated day is the riskiest date of the year for outdoor walks at noon in the area of the deadly spot (in the example this is the Los Angeles area), as if by chance a stream of fast alpha particles occurred at that time, they would reach the Earth's surface at that place. The moments of invasion of alpha particles are unpredictable, but the dates of the maximum risk from them (the dates of coincidence of the two directions – of the movement of the alpha particles and the direction of the geomagnetic vector) can be calculated according to the proposed hypothetical mechanism from the latitude data of the site and they were tabulated in Table 3[4]. As stated above, the dates of maximum risk of alpha particle damage during a midday outdoor walk estimated by the proposed hypothetical mechanism for Los Angeles are February 26 and October 15, and for New York, they are April 6–7 and September 5 – 6.
A study of the influence of averaged alpha particle fluxes on the individual US states
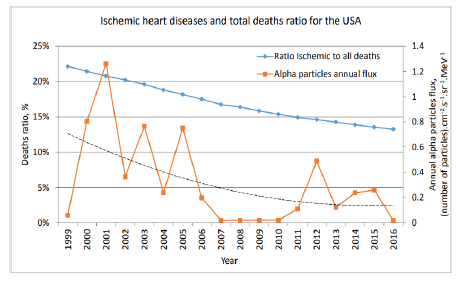
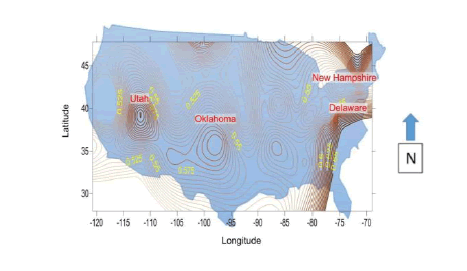
As it was mentioned above, a well-pronounced relationship between the annual average flux of solar alpha particles with high energy and the annual average mortality from IHD is only noticeable for some small area countries of mid-latitudes [44]. For large countries such as the USA, which also is located in the mentioned above zone of latitudes 28°N – 48°N, the average annual mortality from IHD does not depend on the average annual flux of high-energy solar alpha particles. This observation leads to the conclusion that if there is a lethal effect of high energy alpha particle radiation on mortality, it is short-lived in time and is in the form of a spatially variable patch of a limited area on the Earth’s surface – impact (deadly) spot. The effect on mortality from such radiation is noticeable in the statistics of countries with a small area, which are repeatedly covered entirely by this deadly spot but is masked in the statistics of the large countries where it affects only part of the total territory of the country. Masking is the stronger the shorter the impact and when only a part of the territory of the large country is covered by the deadly spot. However, it can be seen from Figure 4 that there is a general trend of synchrony between IHD deaths to total deaths ratio for the USA and the mean annual flux of solar alpha particles. Data for individual states were used in the case of the USA to verify the validity of the above inference, i.e. to what extent the sought relationship between IHD mortality and alpha particle flux depends on the area of potentially affected territory. The interface (CDC Wonder) of the Centers for Diseases Control and Prevention, USA was used, in which the variables of mortality (deaths number and mortality crude rate), State (all states separately), Year (for all years of statistics – 1999 to 2016), Place of death (All), ICD sub-chapter (Ischemic heart diseases), Gender (Females) were chosen as input parameters [13]. Female mortality data were used because worldwide women live longer than men and deaths from IHD during alpha particle intrusions mostly affect the elderly, i.e. more women. Over the 18 years included in the study, for almost all states except Alaska there were correlations statistically significant at the 0.05 level, ranging from 0.464 to 0.589,between IHD mortality and annual average alpha flux. I.e. for the USA, the above-mentioned conclusion is confirmed, that breaking the studied territory into smaller areas (states) leads to highlighting a relationship between IHD mortality and alpha radiation flux. The distribution of these correlation coefficients on the territory of the USA is shown in Figure 5, obtained by the software Surfer 10, with the "minimum curvature" approximation procedure applied to the correlation coefficient data and the average coordinates of each state. For 4 states, there is a higher correlation and higher level of statistical reliability (0.01 level of statistical significance) between annual IHD mortality and mean annual cosmic alpha flux — these are Delaware (correlation coefficient 0.616), New Hampshire (correlation coefficient 0.609), Oklahoma (correlation coefficient 0.595), and Utah (correlation coefficient 0.631). For each of these states, countyby-county data were extracted through the CDC Wonder interface, with the remaining selected variables being the same as listed above.
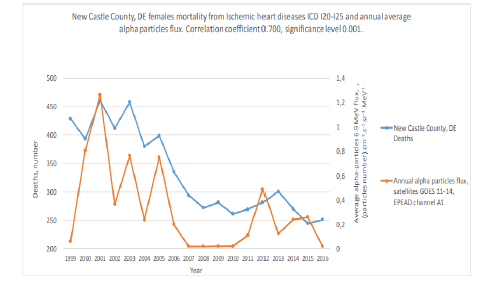
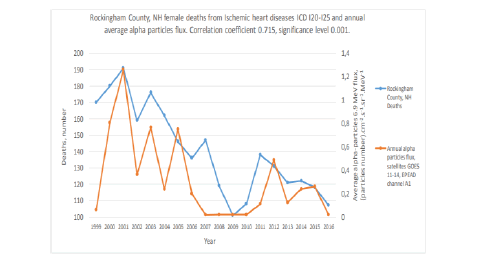
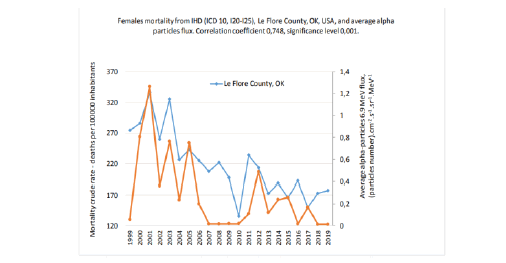
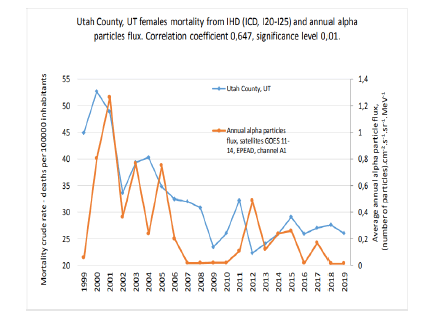
For the four states listed, the correlation coefficients between the year-averaged alpha flux and the annual number of deaths (or annual crude death rate, the parameter with the higher correlation coefficient was chosen) from IHD were determined for each county in the state. The largest correlation coefficients were obtained for: New Castle County (Delaware), correlation coefficient of 0.700, and a significance level of 0.001 (Figure 6), for Rockingham County (New Hampshire), with a correlation coefficient of 0.715, a significance level of 0.001 (Figure 7), for Le Flore County (Oklahoma), correlation coefficient 0.748, significance level 0.001 (Figure 8), for Utah County (Utah), correlation coefficient 0.647, significance level 0.01 (Figure 9). The obtained results show that within the territory of the USA, there are points where the dependence between mortality from IHD and cosmic alpha radiation is clearly expressed
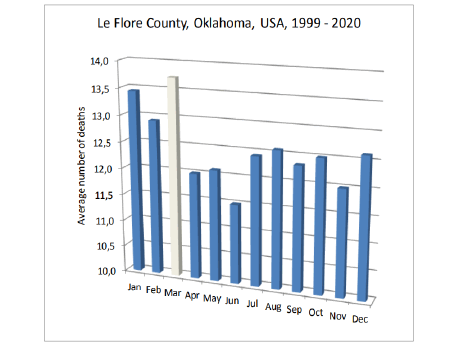
Monthly mortality data were extracted from the same source for the four counties with a high correlation between IHD mortality and alpha radiation. The data were averaged for each of the months separately over the years 1999–2020. For all four counties, a smooth change in mortality is observed during the year from the highest mortality in winter to the lowest in summer, possibly related to changes in temperature. Against this background, a local peak in IHD mortality is observed in March for all four counties. This peak is even the main one during the year for Le Flore County (Oklahoma), (Figure 10). More subtle is the peak in IHD mortality in October. The study of the rapid processes of the impact of alpha particles on IHD mortality presented in section 3.3 below showed that the peaks in IHD mortality in March and October are due to the coincidence at this time of the year between the inclination of the geomagnetic vector for the listed counties and the solar culmination. For example, for Le Flore County, Figure 8 and Table 3 show that the riskiest days of the year are March 5 and October 9.
A study of the influence of instant alpha particle fluxes on the individual US states
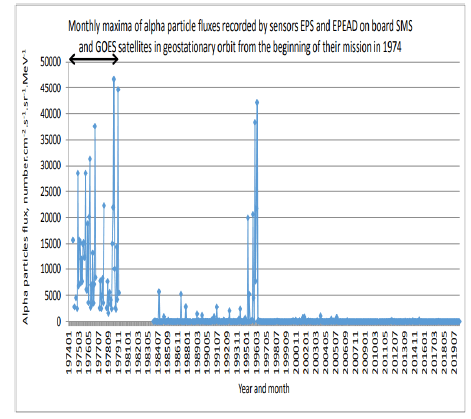
The SMS and GOES series satellites have been operating in geostationary orbit, recording alpha radiation fluxes since 1974. Figure 11 shows the monthly maxima in alpha radiation fluxes recorded by satellites up to 2019, the last prepandemic year. Over the years, the maxima appear to be clustered around the "increasing activity" phase within the 11-year cycle of solar activity. During the previous few cycles, solar activity was decreasing. From Figure 11 it can be seen that in synchrony the maxima of the alpha particle fluxes in the last 27 years decrease in magnitude and frequency of occurrence. During the same period, the death rate from IHD in the USA also decreased. The highest magnitudes have the alpha radiation fluxes registered in the first years of satellite operation in 1975-1979, marked in the figure with a double arrow.
Presumably, the hypothetical alpha particle fluxes associated with the recorded indicator alpha particle fluxes during this interval of years are also of greater magnitude, and therefore of greater negative health impact. Unfortunately, as mentioned above, the US, the only country providing researchers with complete and accessible statistics, stopped supporting the date of death parameter in individual death data after 1992. This limits the ability to monitor the rapid response in IHD mortality due to the effects of alpha particle fluxes after 1992. Combined, the two constraints – high-magnitude alpha fluxes only in the interval 1975–1979 and individual death date data only up to 1992 – determine the time frame for the study of the effects of rapid alpha particle exposure processes on health only up to the interval 1975 - 1979, and only for the USA.
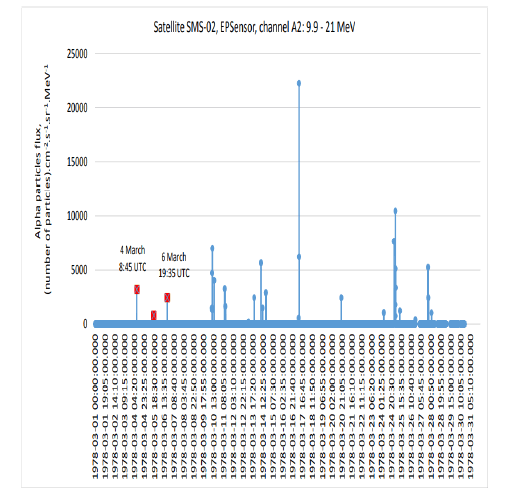
The alpha radiation recorded by satellites is not continuous over time but is the result of individual short-term peaks. It is natural to expect that it is during these peaks that the harmful effects linking alpha radiation to IHD mortality occur. Figure 12 shows the recorded alpha radiation fluxes in March 1978.
Figure 12: Moments of registration of alpha radiation from the SMS-02 satellite in March 1978. The moments of registration of alpha particles shown in the figure are scattered all over the planet, only a small part of them fall on the territory of the United States. Red dots indicate alpha particle fluxes whose impact on US IHD mortality is analyzed in detail below
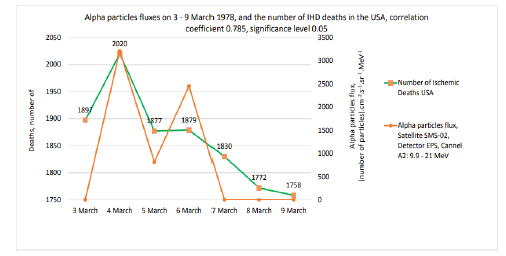
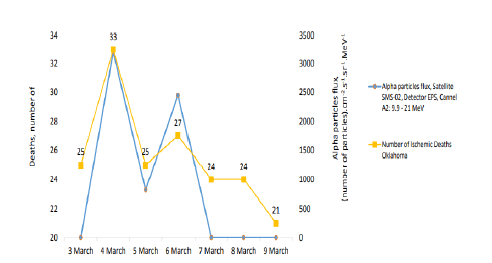
To examine the degree to which the change in the number of US IHD deaths is synchronous with the recorded alpha flux, the daily number of US IHD deaths was calculated for seven consecutive days around the date(s) of recording of the flux – three days before, the day of registration and three days after registration. An example of such a study is shown in Figure 13. The impact on the number of daily IHD deaths in the US in the time interval from March 3rd to 9th of two alpha particle fluxes recorded on the 4th and the 6th was tracked. They are shown in Figure 12 with red dots. The influence of the March 5th alpha particle stream is negligible. Figure 13 show that there is a high, statistically significant correlation (a causal relationship) between alpha particle fluxes over the interval and the US number of deaths from IHD.
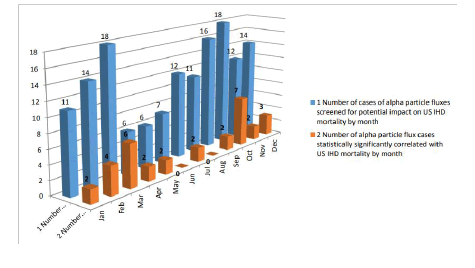
Figure 14 shows all 145 cases of recorded alpha particle fluxes with a possible contribution to IHD mortality in the United States during the interval 1975–1979 studied in the manner described. Of these, 32 cases showed a high, statistically significant correlation between the flux of registered alpha particles and the number of IHD deaths in the US. In many of the other cases studied, such an effect was found partially – only for individual states, without a statistically significant effect on the total number of deaths for the US. An interesting feature can be seen in Figure 14 the most numerous cases with a statistically significant correlation are in March and October. This is a confirmation of the validity of the mechanism described above, according to which the places with the coincidence between the solar culmination and the inclination of the geomagnetic vector have the maximum risk of penetration of alpha particles to the Earth's surface. In the apparent movement of the Sun during the year, its culmination increasing in spring and decreasing in summer and autumn, in March and October coincides with the inclination of the geomagnetic vector for the southern states, i.e. these are the riskiest months for dying from cosmic alpha particle-induced IHD death. The southern states along the east and west coasts of the US have high population densities, leading to increased IHD mortality at this time of year (see also Figure 10).
Figure 14: 1.Number of all cases studied for a possible influence of recorded solar alpha particle fluxes on the number of IHD deaths in the US population during the interval 1975 – 1979. 2. Number of those of the studied cases in which a high, statistically significant correlation was found (with a significance level above 0.05)
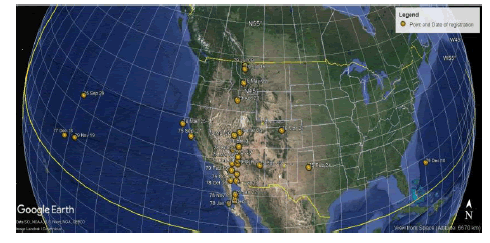
Figure 15 shows the points of registration of alpha particle fluxes for which there is a highly statistically significant correlation with the number of deaths from IHD in the US population during the years interval 1975-1979. The attachment of registration points to the - 115°W longitude meridian seems unnatural.
The registration points in March and October are densely located in the middle of the above-discussed equator-parallel zone between latitudes 28°N and 48°N. According to the hypothetical mechanism discussed above, the registration points over the Pacific Ocean were indicating that on the relevant dates, deadly spots of intruding alpha particles were occurring at 30° in an eastward direction, i.e. on the west coast of the USA. A worrying trend is that the vast majority of registration points had been over the western USA, while their corresponding deadly alpha particle spots covered the more densely populated US East Coast.
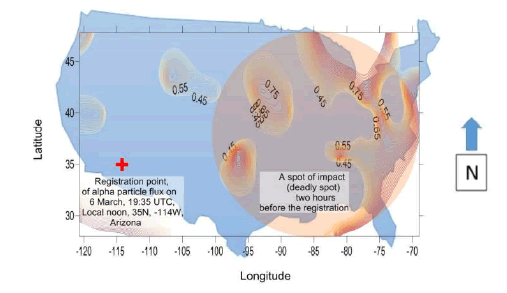
In Figure 16, a red cross indicates the point of registration of the alpha particle stream from March 6th, 1978, 19:35 UTC, with coordinates (35°N-114°W).
The point of impact is about 30° east, where the moment of impact occurred two hours earlier than the moment of registration. The figure shows that areas of increased correlation between alpha particle flux (the indicator flux) and the number of IHD deaths are scattered across the eastern United States. The area covering them is the deadly spot, tentatively denoted by a circle centered on the point of impact. The actual shape and area of the deadly spot on the Earth's surface cannot be precisely determined, but it can be assumed that the effect is observable in a radius of up to about 1000 km around the point of impact and weakens with distance from it.
Within the deadly spot, the impact depends on the specifics of the conditions on the Earth's surface – for example, in clear weather at midday, more people should be expected to be outdoors (the highest risk) than in clouds and rain. This explains the patchy nature of the impact within the deadly spot. The area of the deadly spot covers the most densely populated eastern parts of the US, which explains the fact that the peak in deaths on March 6th, 1978, is observed in the statistics for the US at the national level. The question of the peak of March 4th, 1978 – it was registered when it was night over the USA – remained undisputed.
Numerous examples can be drawn from the satellite and mortality data to show that if the alpha particle flux registration point does not fall over the US or near its west coast, it does not affect US IHD deaths, however large the magnitude of this flux. There is one exception to this rule – when around the vernal and autumnal equinoxes the time of registration of the alpha particle flux is 12 hours ahead of local US noon (i.e. it is nighttime in the US), such a flux affects the number of deaths in the US statistically significant.
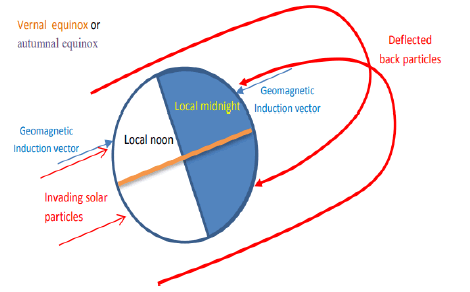
There are only two such cases for the interval of years 1975 – 1979, they were in 1978. One was on March 4th, 1978 (two weeks before the vernal equinox) and the other happened on September 30th, 1978 (a week after the autumnal equinox). These cases can be explained by assuming that alpha particles were flying past the Earth, whose movement changes its direction to the opposite as a result of the action of the geomagnetic field and reaching the Earth’s surface from the night side of the Earth (Figure 17).
There are points on both opposite sides of the Earth for which the vectors of geomagnetic induction are parallel. The reversed alpha particles cause the appearance of a deadly spot on the night side of the Earth’s surface at midnight, at the location where the condition for their direction of motion to coincide with the direction of the geomagnetic vector is satisfied. If this hypothesis is true, the night sky at midnight around the equinoxes also carries risks of death from IHD.
For example, the point of registration for the stream of high-energy alpha particles recorded by the satellite on March 4th, 1978 at 8:45 UTC is at coordinates 35°N, 49°E (local noon time for that point, in Azerbaijan). At this time local midnight is located at longitude - 131°W and the nighttime point of impact is 30° eastward, i.e. 35°N, - 101°W (in Oklahoma).
As can be seen in Figure 18, the nocturnal impact, centered just over Oklahoma, resulted in more IHD deaths in Oklahoma than the daytime impact two days later, for which Oklahoma remained in the western periphery (Figure 16).
Figure 18 shows that Oklahoma was one of the states most affected by the two alpha particle streams, night and day, that reached its territory in the interval March 3-9, 1978.
Table 4 presents the cases of statistically significant correlations between peak alpha particle flux(s) with a point of registration over the US territory and the daily number of IHD deaths in the US in 1978.
Table 4. Statistically significant correlations between alpha particle fluxes and the daily number of IHD deaths in the United States in 1978
| Daily deaths | ||||||||||
|---|---|---|---|---|---|---|---|---|---|---|
|
Date |
1st day | 2nd day | 3rd day | 4th day | 5th day | 6th day | 7th day | Average deaths in passive days, number | Difference between Average deaths in active days and Average deaths in passive days, number | Ratio, % |
|
09-Jan-78 |
2189 | 2179 | 2067 | 2322 | 2246 | 2172 | 2160 | 2169 | 153 | 7 |
|
13-Feb-78 |
1988 | 1973 | 2012 | 2094 | 1940 | 1981 | 1996 | 1982 | 112 | 6 |
|
4-6 March 78 |
1897 | 2020 | 1877 | 1879 | 1830 | 1772 | 1758 | 1814 | 111 | 6 |
|
13-Mar-78 |
1837 | 1816 | 1809 | 1907 | 1824 | 1780 | 1767 | 1806 | 102 | 6 |
|
20-Mar-78 |
1798 | 1804 | 1771 | 1846 | 1792 | 1767 | 1726 | 1776 | 70 | 4 |
|
25-Mar-78 |
1767 | 1726 | 1748 | 1790 | 1735 | 1824 | 1746 | 1758 | 32 | 2 |
|
27-Mar-78 |
1790 | 1735 | 1824 | 1746 | 1721 | 1724 | 1742 | 1734 | 94 | 5 |
|
02-Oct-78 |
1642 | 1689 | 1635 | 1763 | 1579 | 1606 | 1699 | 1616 | 102 | 6 |
|
16-Oct-78 |
1688 | 1727 | 1719 | 1765 | 1711 | 1727 | 1720 | 1715 | 50 | 3 |
|
30-Oct-78 |
1669 | 1697 | 1697 | 1761 | 1680 | 1653 | 1738 | 1689 | 72 | 4 |
|
27-Nov-78 |
1807 | 1742 | 1770 | 1871 | 1807 | 1795 | 1735 | 1776 | 95 | 5 |
Bold indicates the number of deaths on days with peaks in alpha particle flux
Intervals of 7 days duration centered on the day(s) with the peak(s) of the alpha particle flux(s) were selected. For three months of the year – April, May, and June, satellite data is missing. For days with peak alpha particle flux, the term "active days" was used, and for those without peak flux, "passive days". It can be seen from the table that for a given interval the number of deaths on active days is greater than the average number on passive days, which is clearly due to the lethal influence of the alpha particle stream. The difference between the number/average number of deaths on active days and the average number of deaths on passive days is the absolute expression of the number of victims who died as a result of alpha radiation. The last column of the table gives the percentage ratio of this difference to the average number of deaths during the passive days of the interval. The average value of this ratio is 5%, i.e. for the US, the number of deaths from IHD has increased by 5% in 1978 as a result of the alpha radiation.
According to the National Center for Health Statistics, USA, the total number of deaths from IHD in the USA in 1978 was 643,176. If 5% of them were victims of alpha particle fluxes, the number of such victims was 32,159 in 1978. Since the beginning of the 21st century, the average annual alpha particle flux has decreased, and so have IHD deaths in the US (Figure 4). Globally, the US is not the country most affected by the deadly effects of alpha radiation. For countries like Malta, Bulgaria, Kyrgyzstan, etc. the relative number of IHD casualties due to alpha radiation is twofold and threefold the US estimate of 5%. If a base value of 5% is taken as a rough estimate of the impact of alpha radiation on global mortality from IHD, it can be calculated that the world loses nearly 450,000 human lives per year as a result of cosmic alpha radiation [11].
Therefore, elderly people around the world must be informed about this dangerous phenomenon. If they are aware of the highest risk dates for the latitude where they live, as well as the riskiest times of the day – noon and midnight – it can add invaluable time to their lives.
Conclusion
The work presents a study revealing in an example of the USA a planet-wide health problem – a relationship between the solar alpha particles with high energy reaching the Earth surface and mortality from the number one killer disease for humanity – ischemic heart disease. The main conclusions following from the hypothetical mechanism of the phenomenon set out above: Those living in the zone parallel to the equator bounded by parallels 28°N and 48°N are at increased risk of death due to the lethal impact of streams of highenergy solar alpha particles:
1. If they are elderly people;
2. Twice a year there are days (weeks) with increased risk. Dates depend on latitude.
3. During the day, the hours around local noon and local midnight are at increased risk. The risk can be reduced by avoiding standing outdoors during risky time intervals.
Acknowledgement
The author expresses his gratitude to the thousands of specialists from NOAA, CDC, USA, without whose noble work the research presented in this work would have been impossible
References
- Takuchev N. Solar corpuscular radiation and mortality from various forms of ischemic heart disease in Bulgaria for the interval 2005-2015. AIP Publ. LLC. 2075(1);130005.
- Takuchev N. 2020 Ischemic Heart Diseases Mortality for Bulgaria Partly Depends on Solar Corpuscular Radiation? ES J. Cardiol. 1(2); 2020.101.
[Crossref]
- Takuchev N. How Ischemic Heart Diseases Mortality Depends on Solar Corpuscular Radiation: A Case from Bulgaria. Chall. Dis. Health Res. 8(1); 2021, 44-55.
- Takuchev N. Does the Angel of Death Sometimes Use Solar Alpha Particles to Take Our Souls?. Does the Angel of Death Sometimes Use Solar Alpha Particles to Take Our Souls?. 6; 2021, 1-40.
- Takuchev N. Solar Corpuscular Fluxes of Alpha Particles and Mortality from Ischemic Heart Disease in Bulgaria, Veliko Tarnovo Bulg. 2021. 17-18.
[Crossref]
- Takuchev N. The Solar Alpha Particles Invading Earth and Ischemic Heart Diseases – the Worldwide Killer Number One, Connected? Lond. J. Res. Sci., 22(5); 2022. 43-51.
- Takuchev N. 2023. The High-Energy Positive Solar Particles Invading the Earth with Contribution to the Mortality from Ischemic Heart Diseases? SCIREA J. Phys..8(2); 2023.2706-8862.
[Crossref]
- Takuchev N. 2023. Alpha particle fluxes and ischaemic heart disease mortality study for Bulgaria and Los Angeles, California, USA. J Mod Appl Phy, 6(2); 2023. 1-10[Crossref]
- Takuchev N. 2023. Solar Alpha Particles and Death from Ischemic Heart Disease. J Cur. Med Res & Op 6(6); 2023. 1615-25.
- Solar corpuscular radiation and mortality from various forms of ischemic heart disease in Bulgaria for the interval 2005-2015
- Google Scholar
- Khan MA, Hashim MJ, Mustafa H, et al. Global epidemiology of ischemic heart disease: results from the global burden of disease study. Cureus. 12(7); 2020. Google Scholar]
[Crossref]
- Centers for Diseases Control and Prevention (CDC), USA, National Centre for Health Statistics (NCHS), Scientific Data Documentation, Detailed Mortality File, 1962-1992.
- Ischemic Heart Diseases Mortality for Bulgaria Partly Depends on Solar Corpuscular Radiation?
- PSTAR: Stopping Power and Range Tables for Protons.
- ASTAR : Stopping Power and Range Tables for Alpha Particles
- Data on the geomagnetic field.2018
- . How Ischemic Heart Diseases Mortality Depends on Solar Corpuscular Radiation: A Case from Bulgaria


