


 5 / 5
5 / 5
Volume 2
Journal of Molecular Cancer
Cancer & Primary Healthcare 2019
May 20-21, 2019
Page 14
Cancer Research & Oncology
Primary Healthcare and Medicare Summit
May 20-21, 2019 | Rome, Italy
25
th
Global Meet on
World Congress on
&
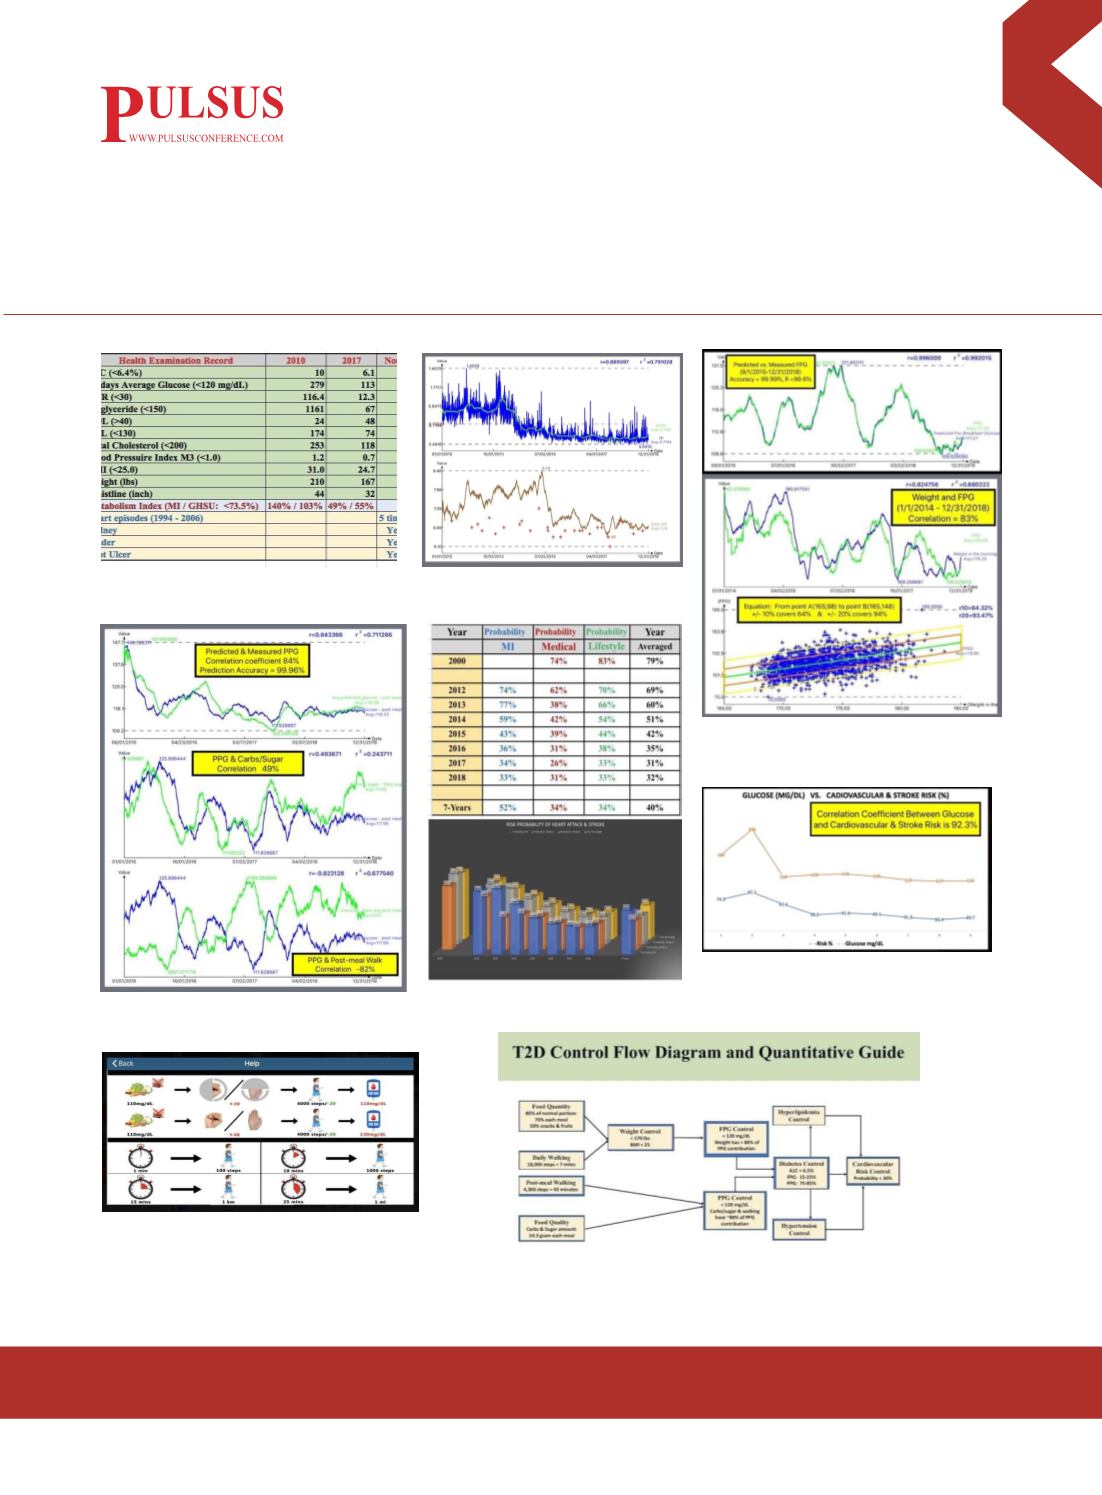
Figure 1: Health Exam
Results Comparison
Figure 2: Metabolism Index and HbA1C
Figure 3: FPG
Figure 4: PPG
Figure 7: Nursing Guide of T2D Control
Figure 8: T2D Control Flow Diagram
Figure 5: Risk Probability of CVD & Stroke
Figure 6: Correlation between Glucose and CVD
Risk